Rahoto is automated recurring reporting software for teams that send the same report every week, month or quarter.
Reports that refresh and send themselves
Ask your data a question, design the answer to your standard, and let Rahoto send it on the schedule you set, checked against the numbers every time.
14-day Starter trial. Plans from $29 per workspace a month. No card to start.
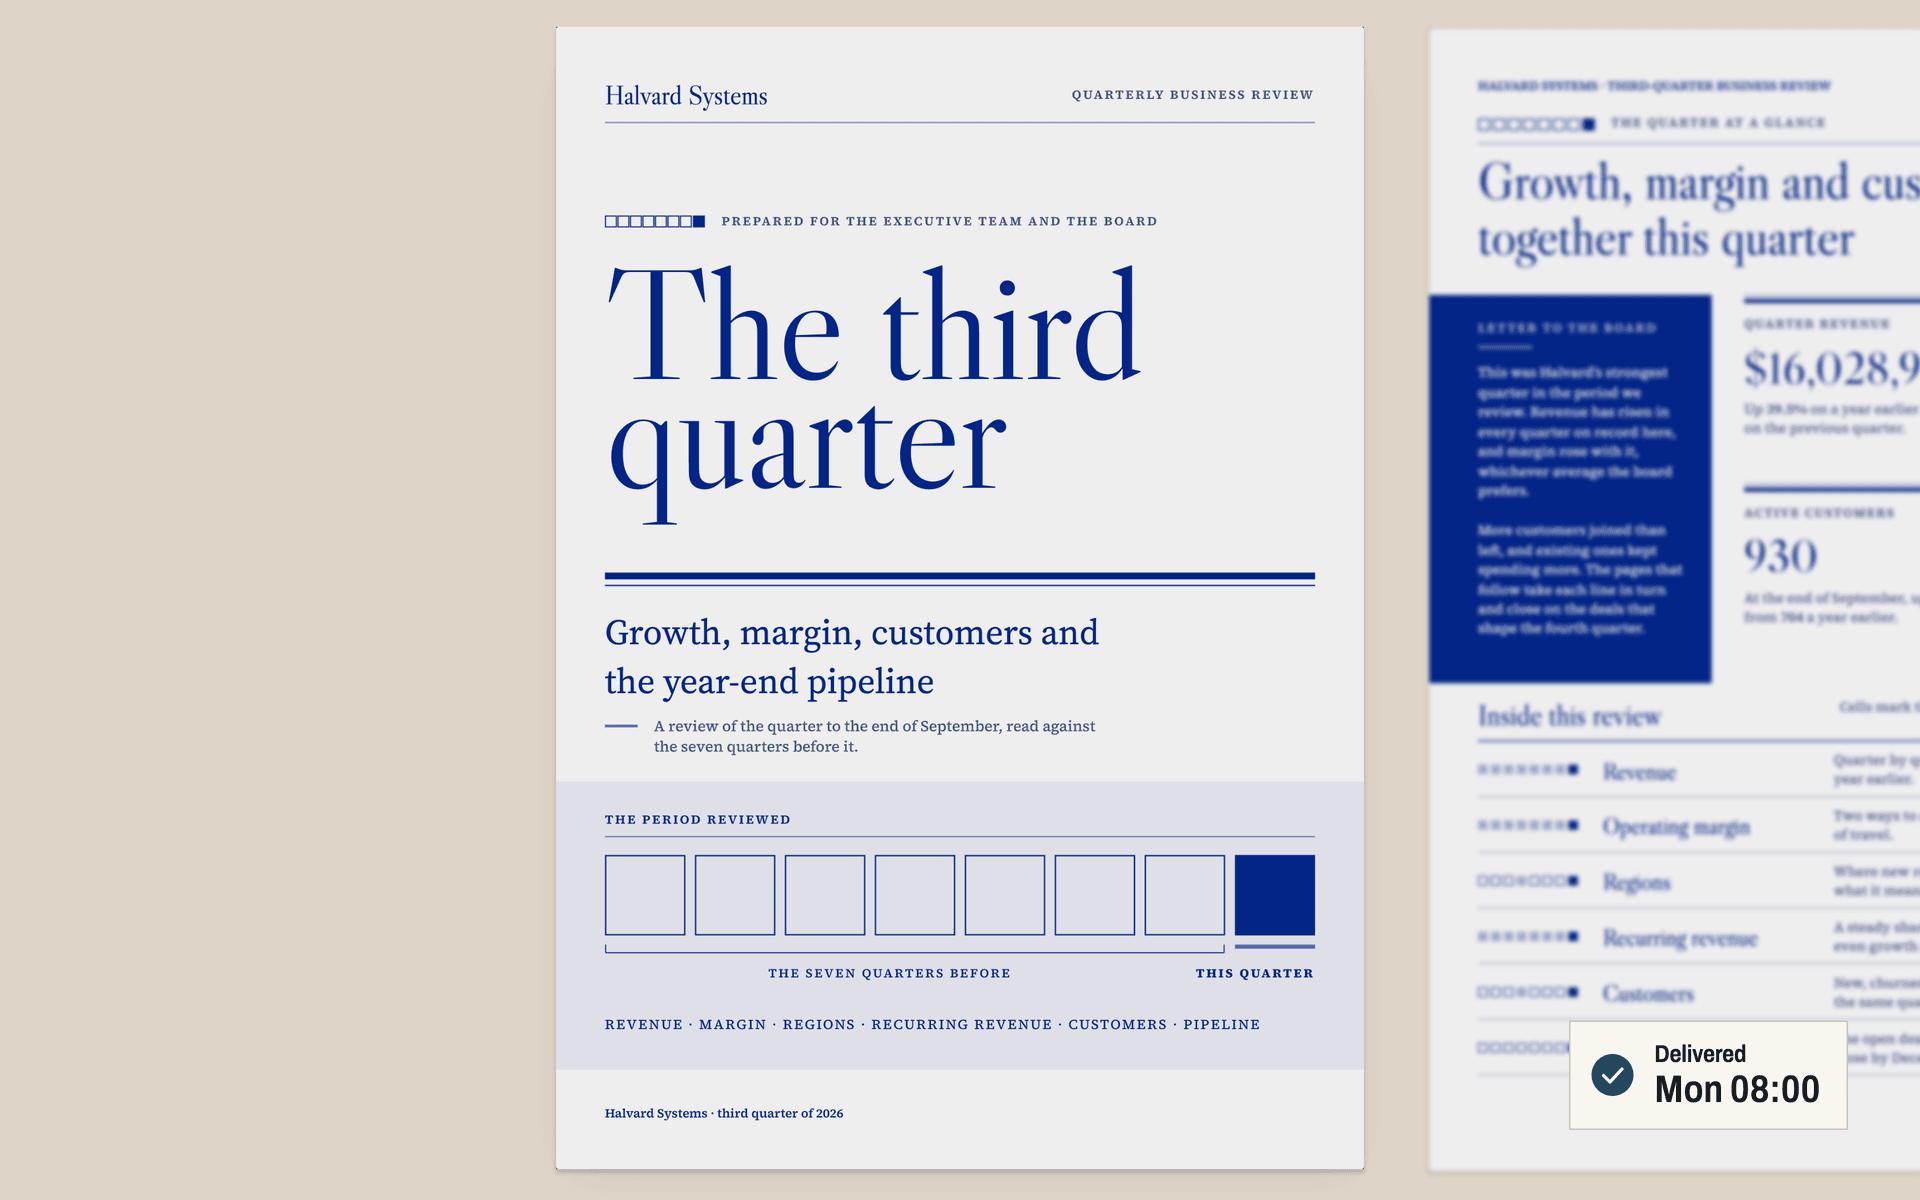
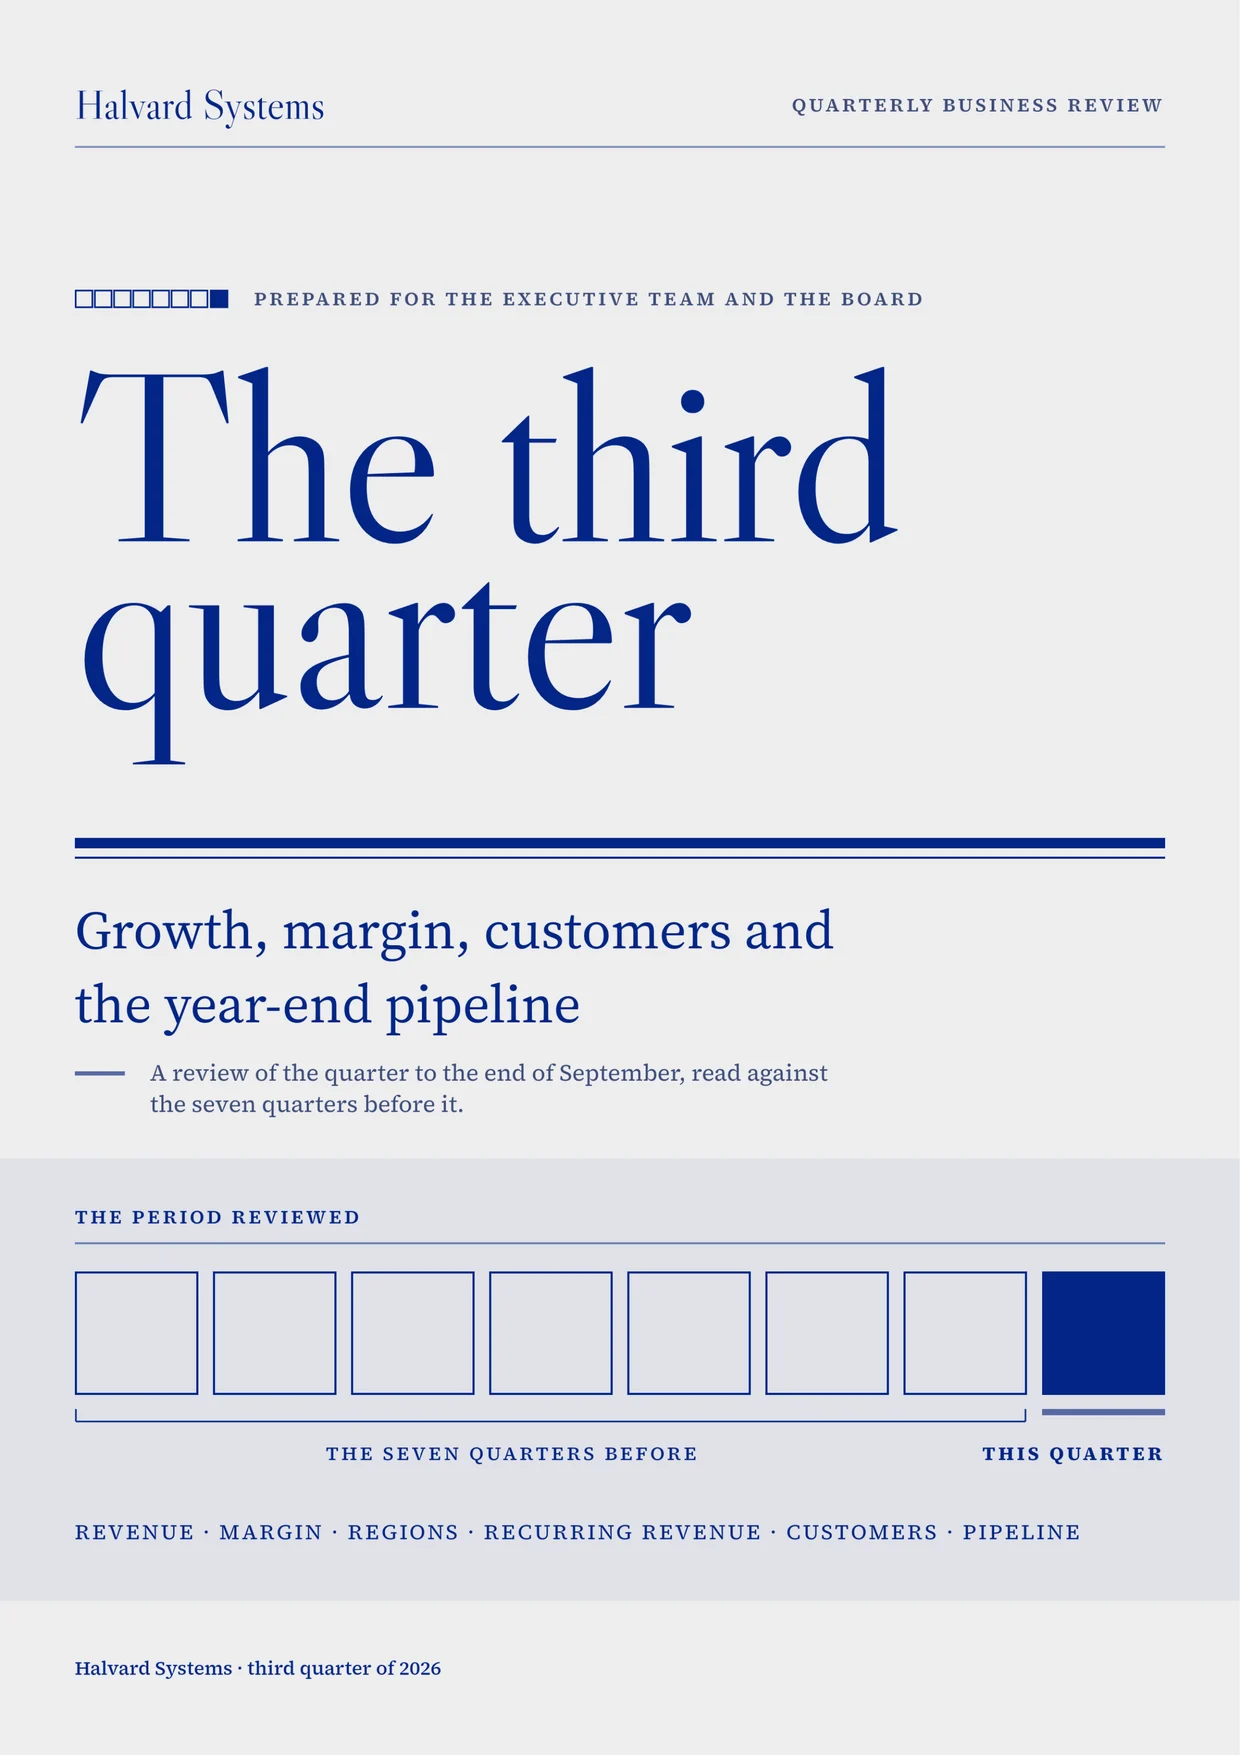
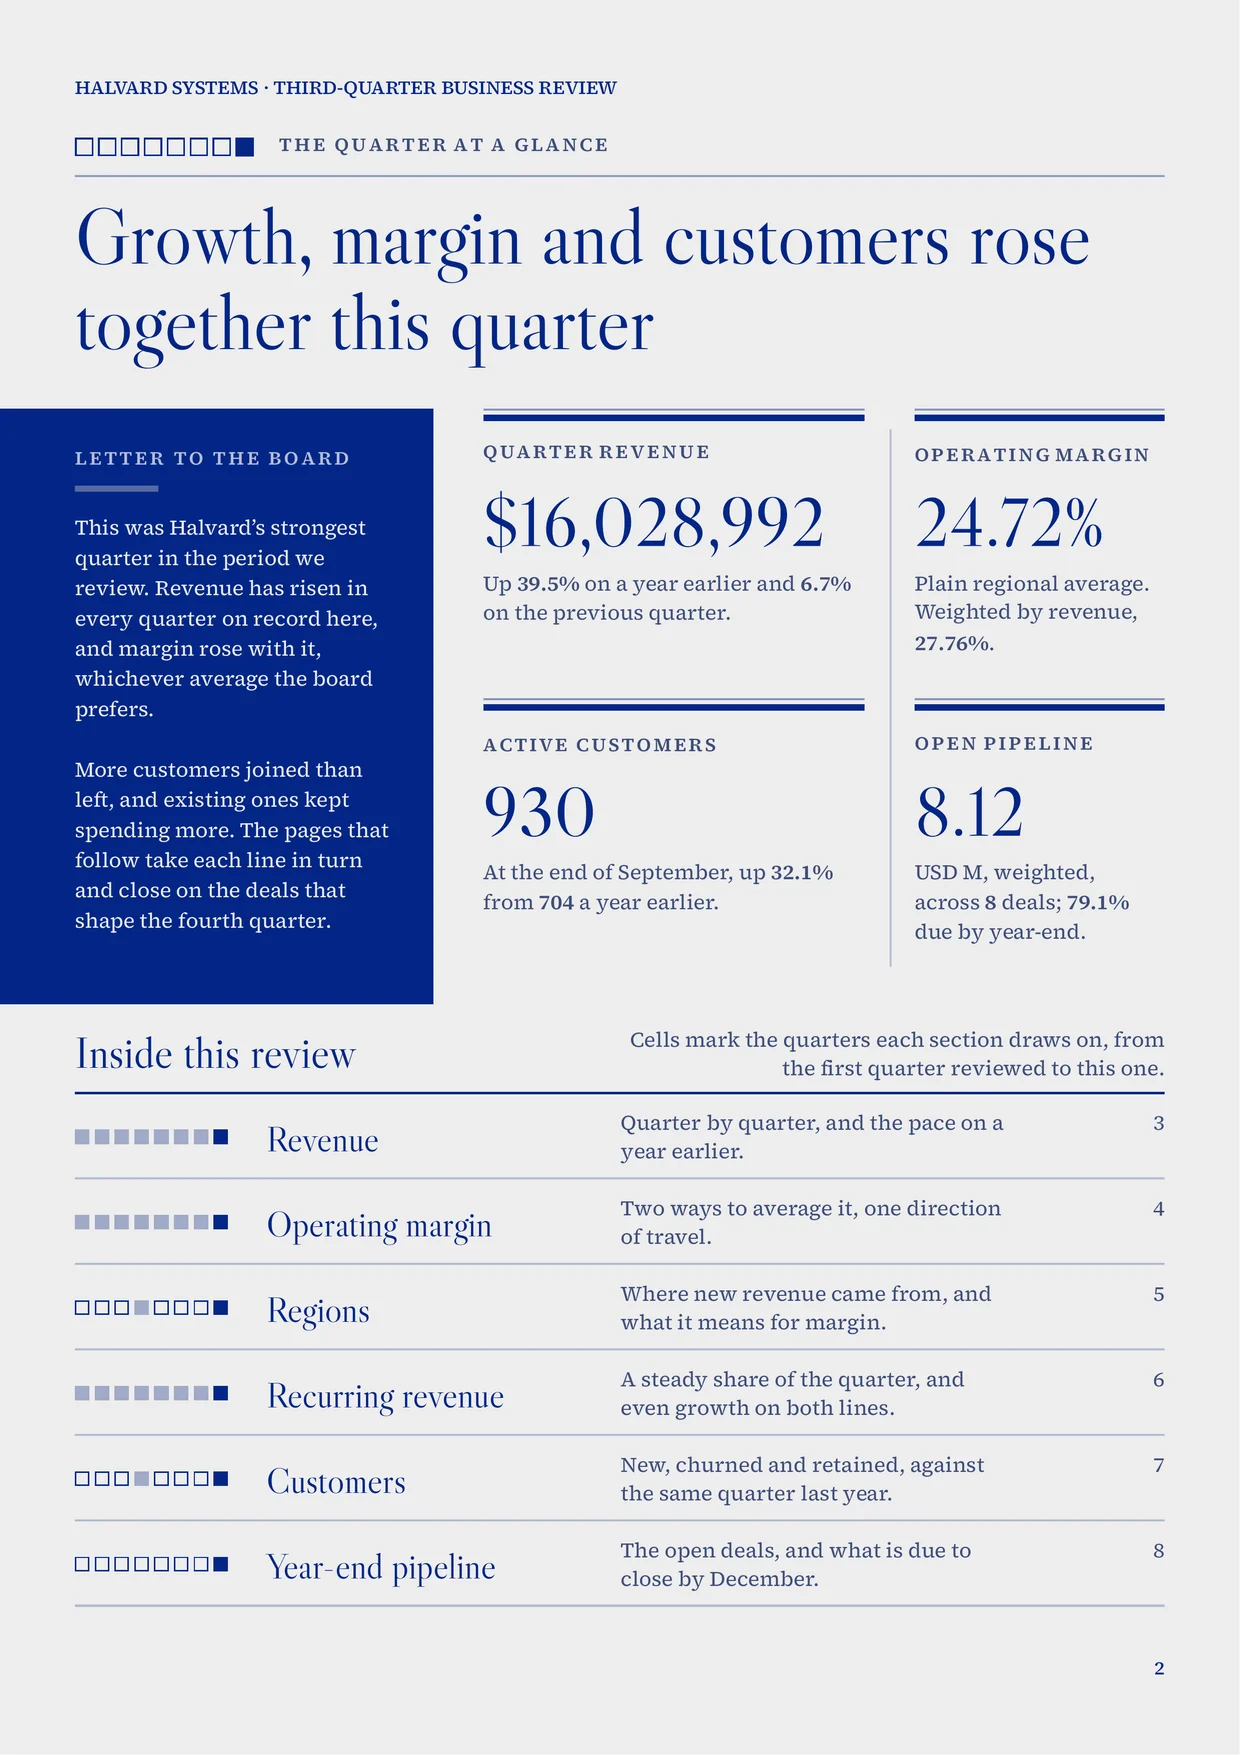
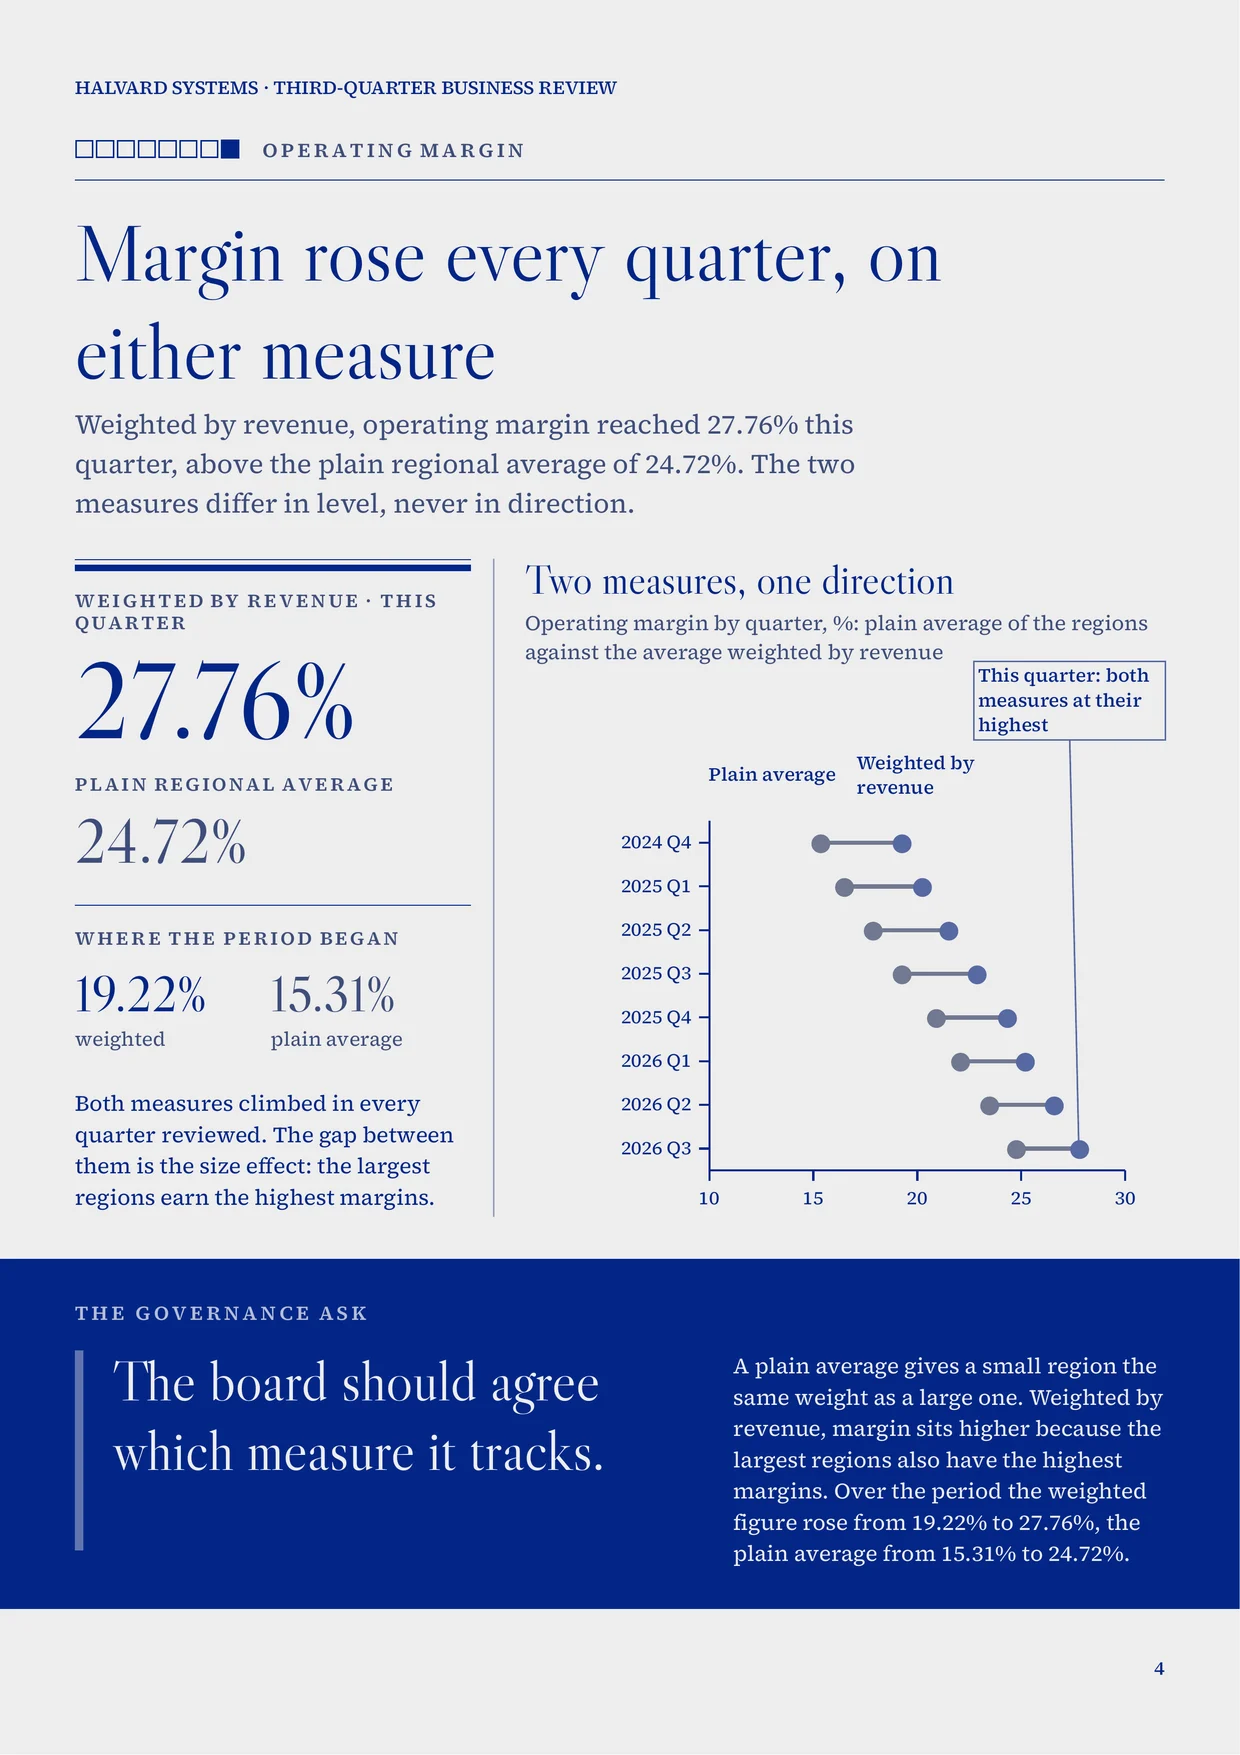
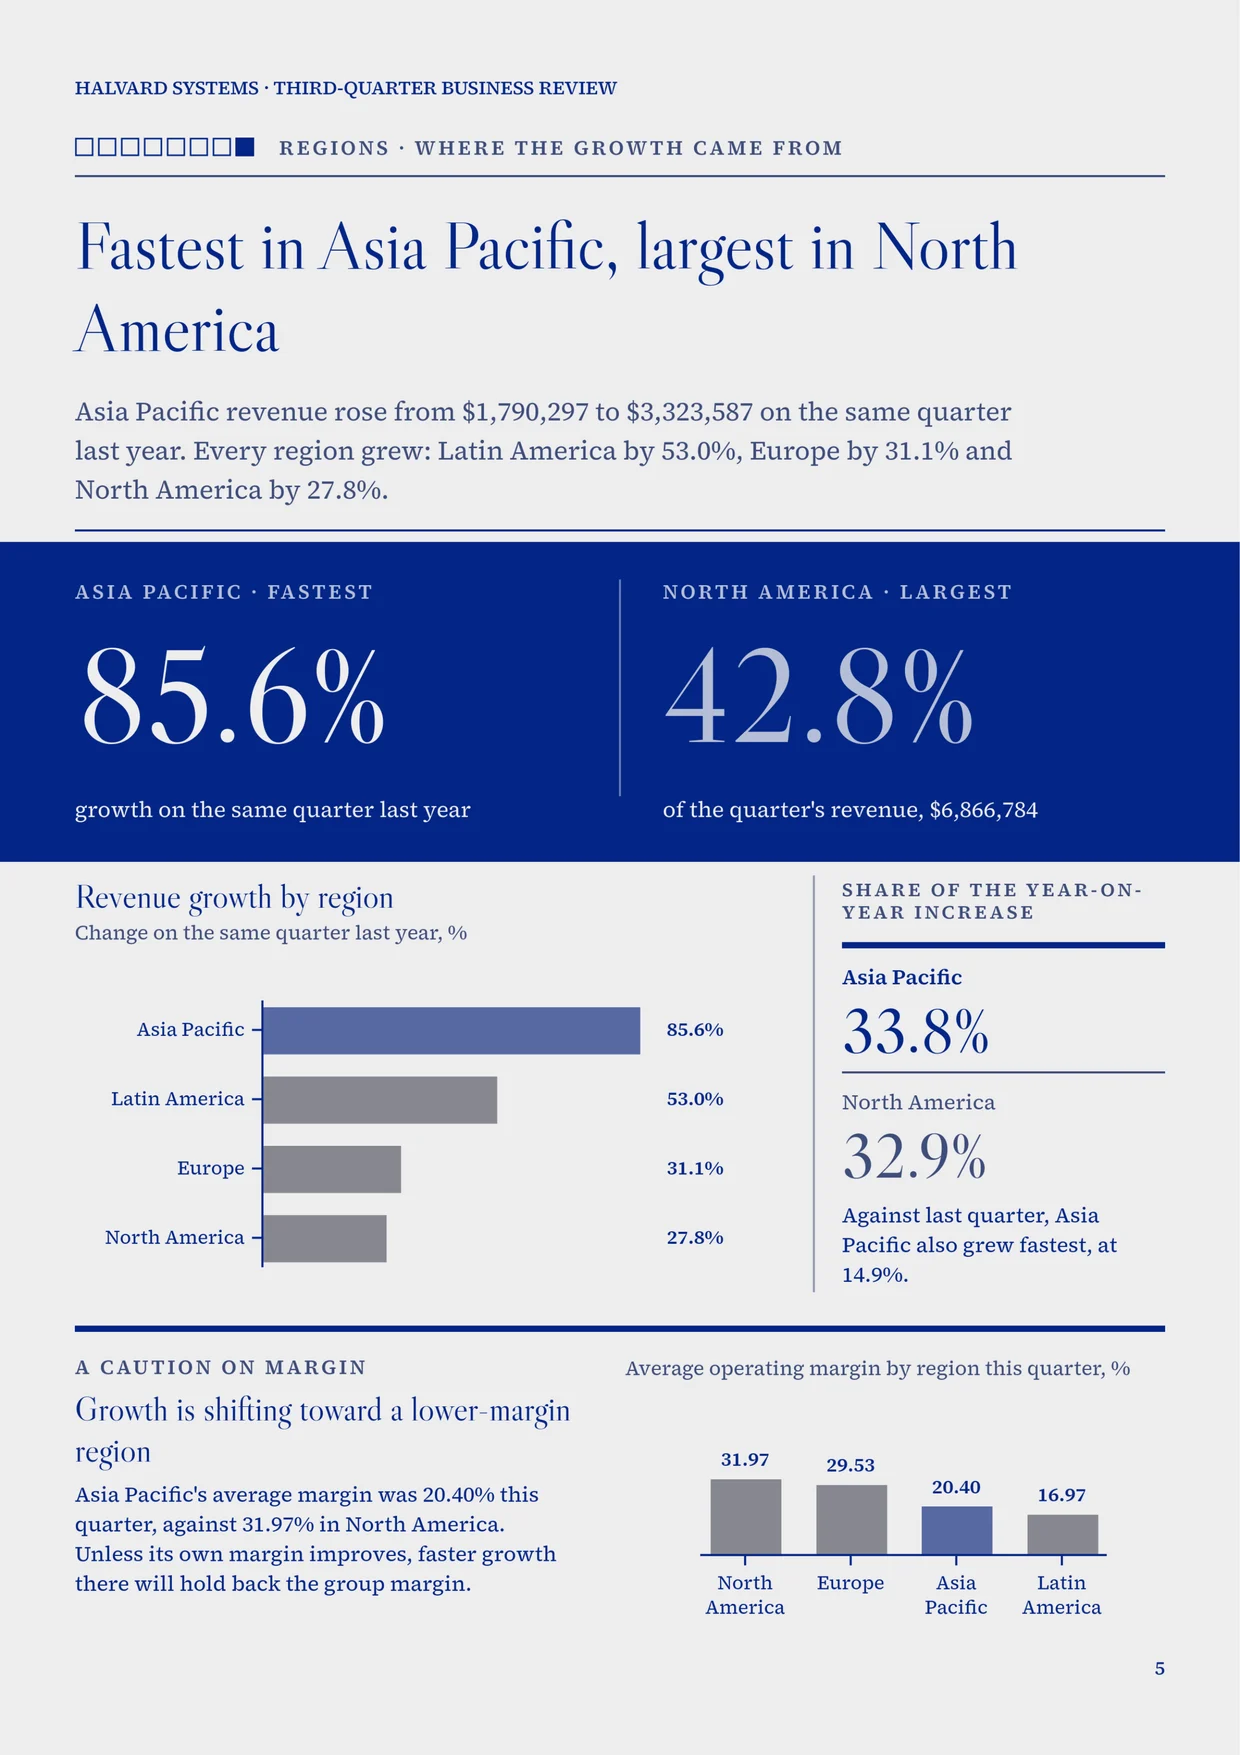
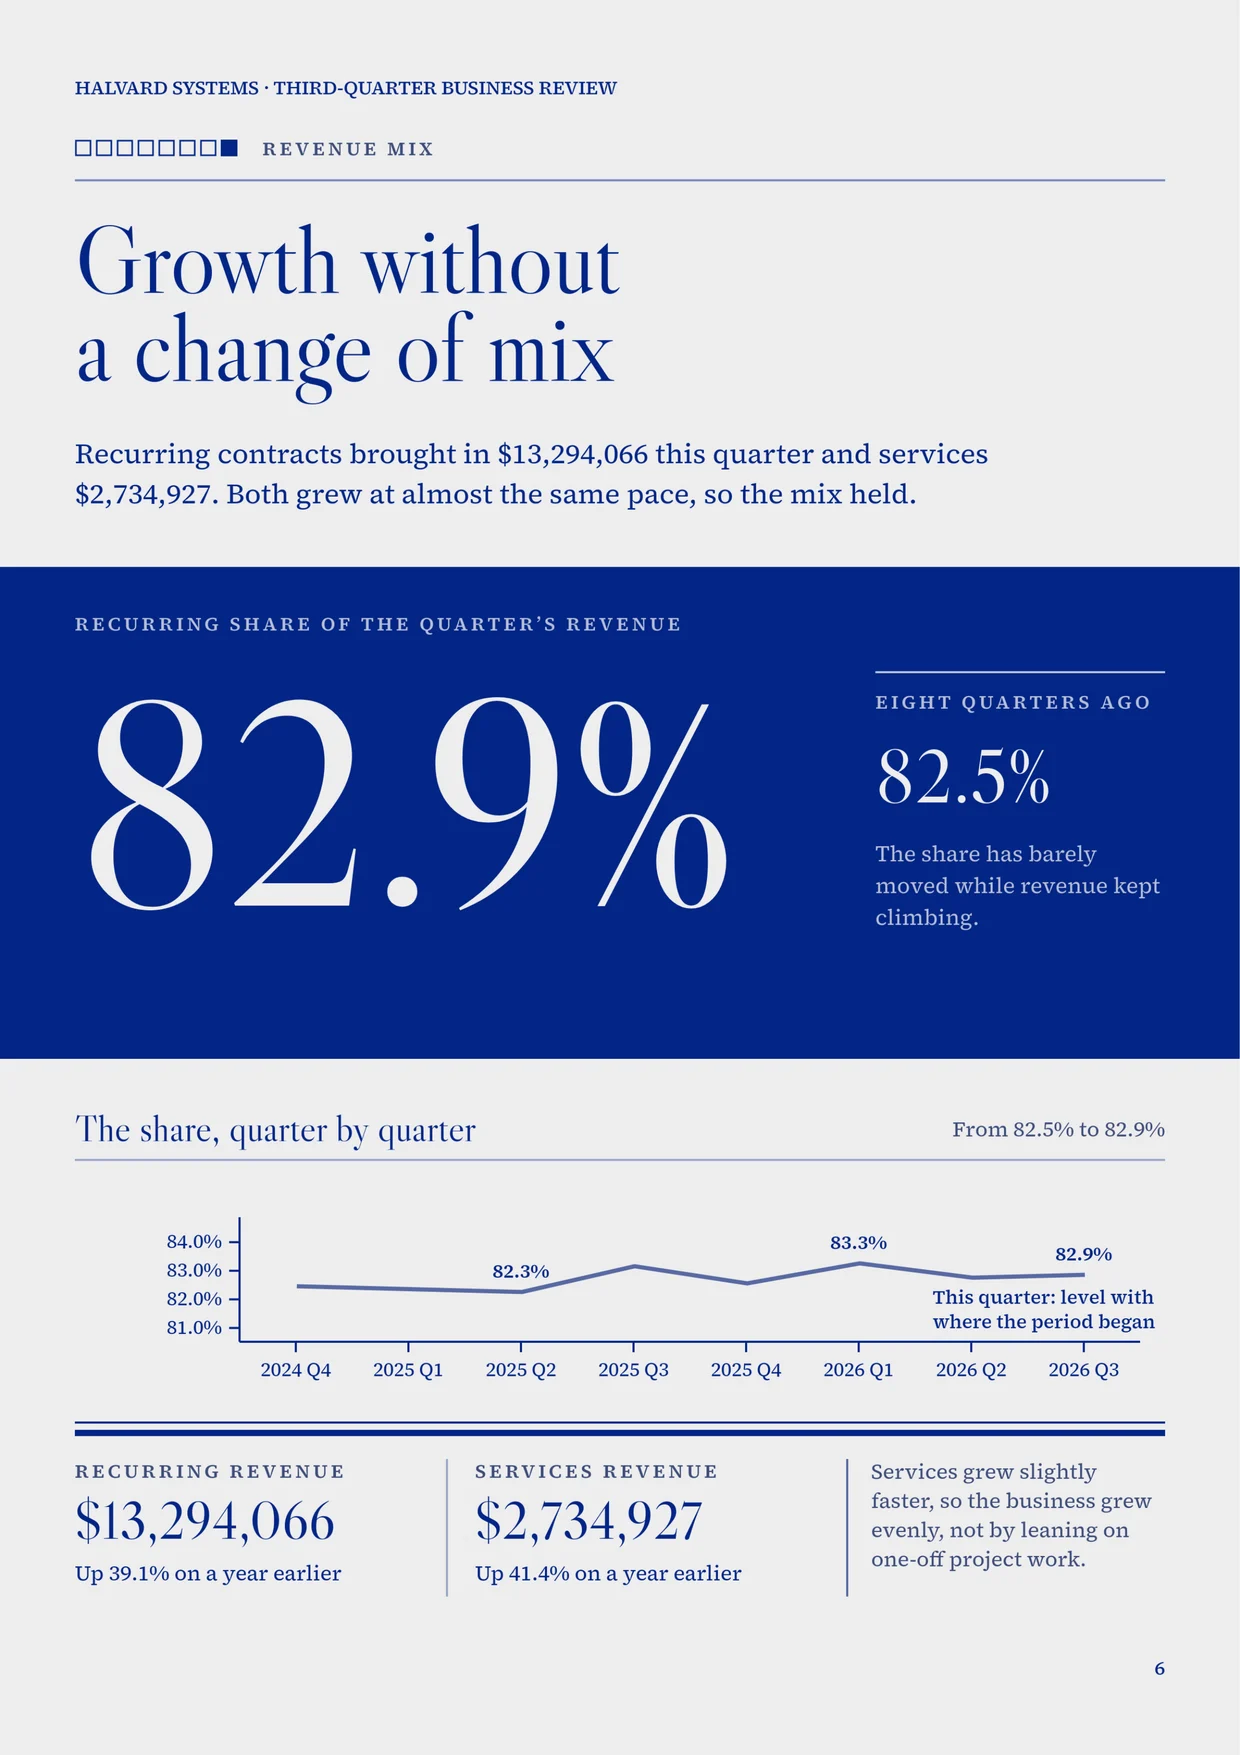
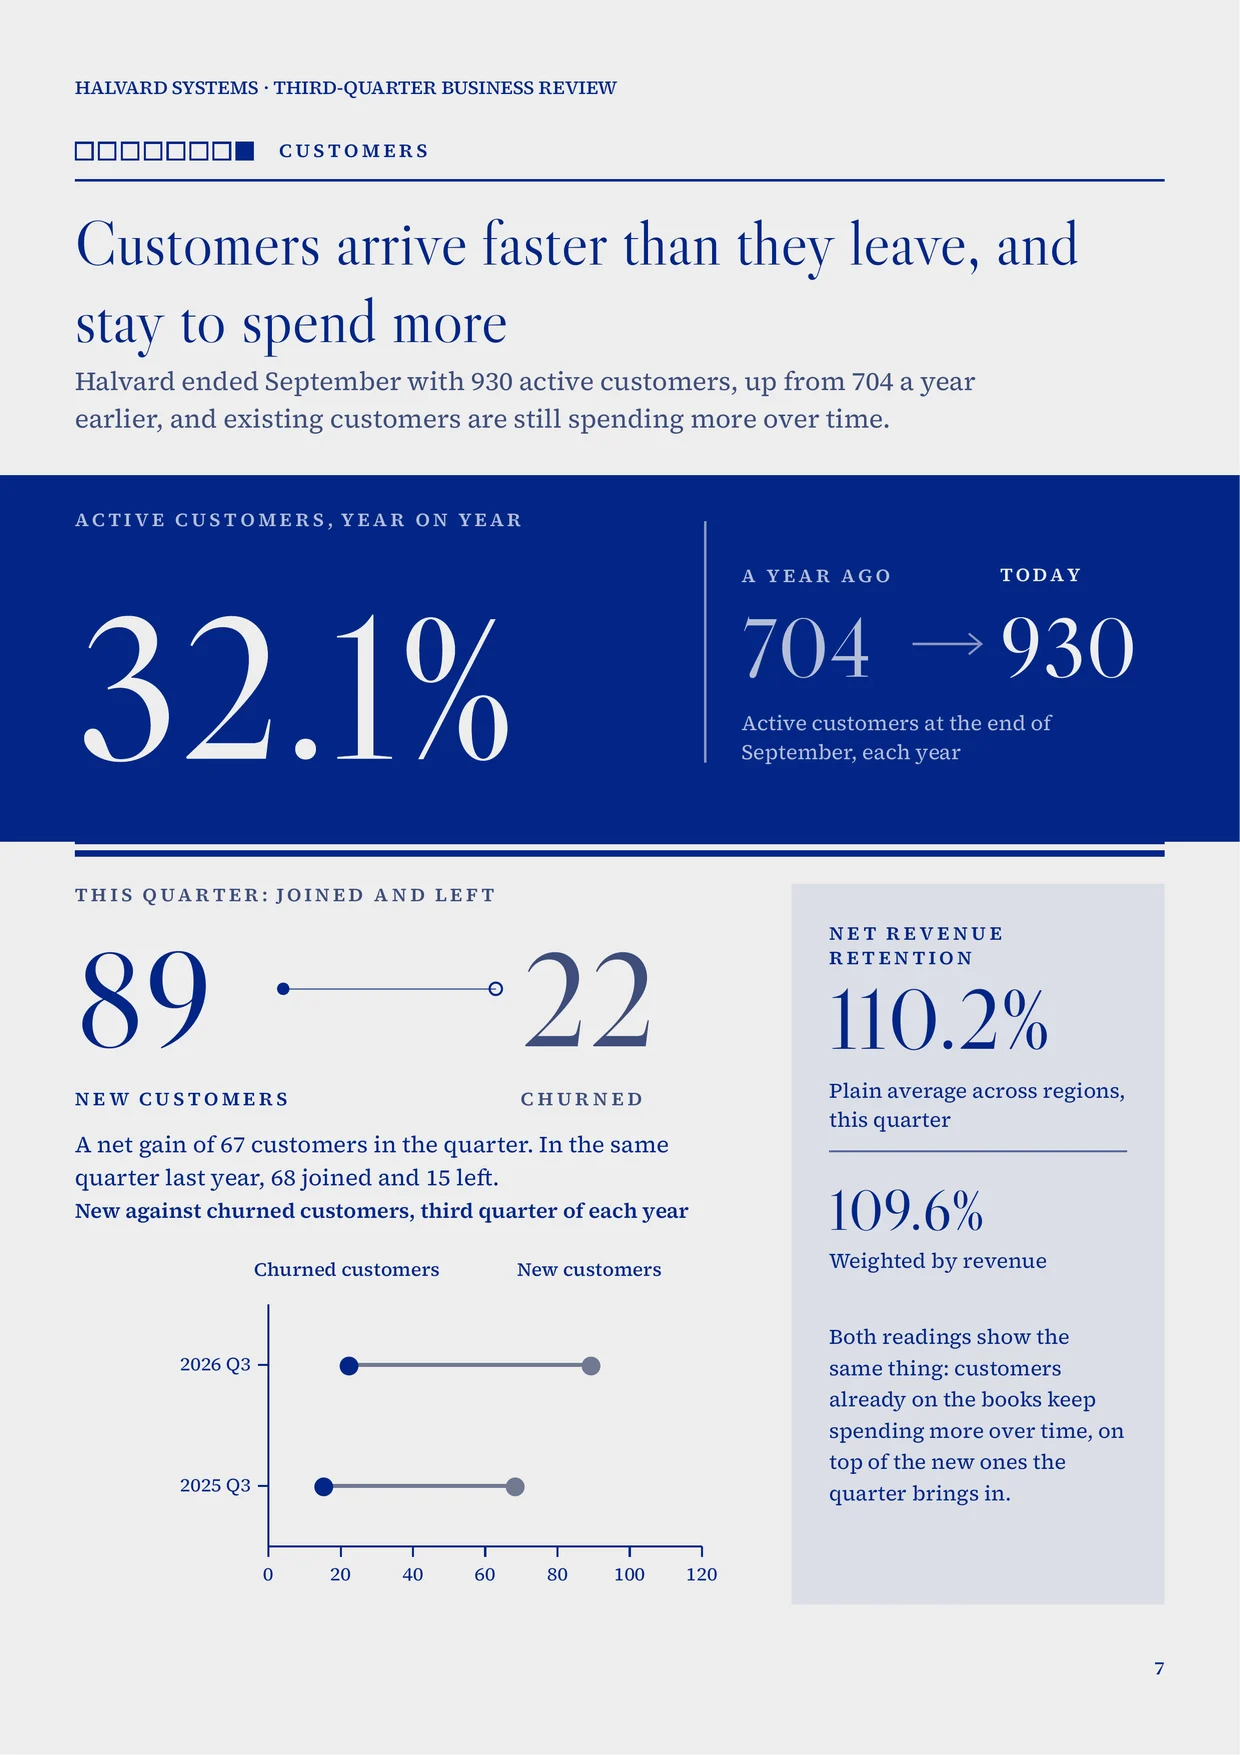
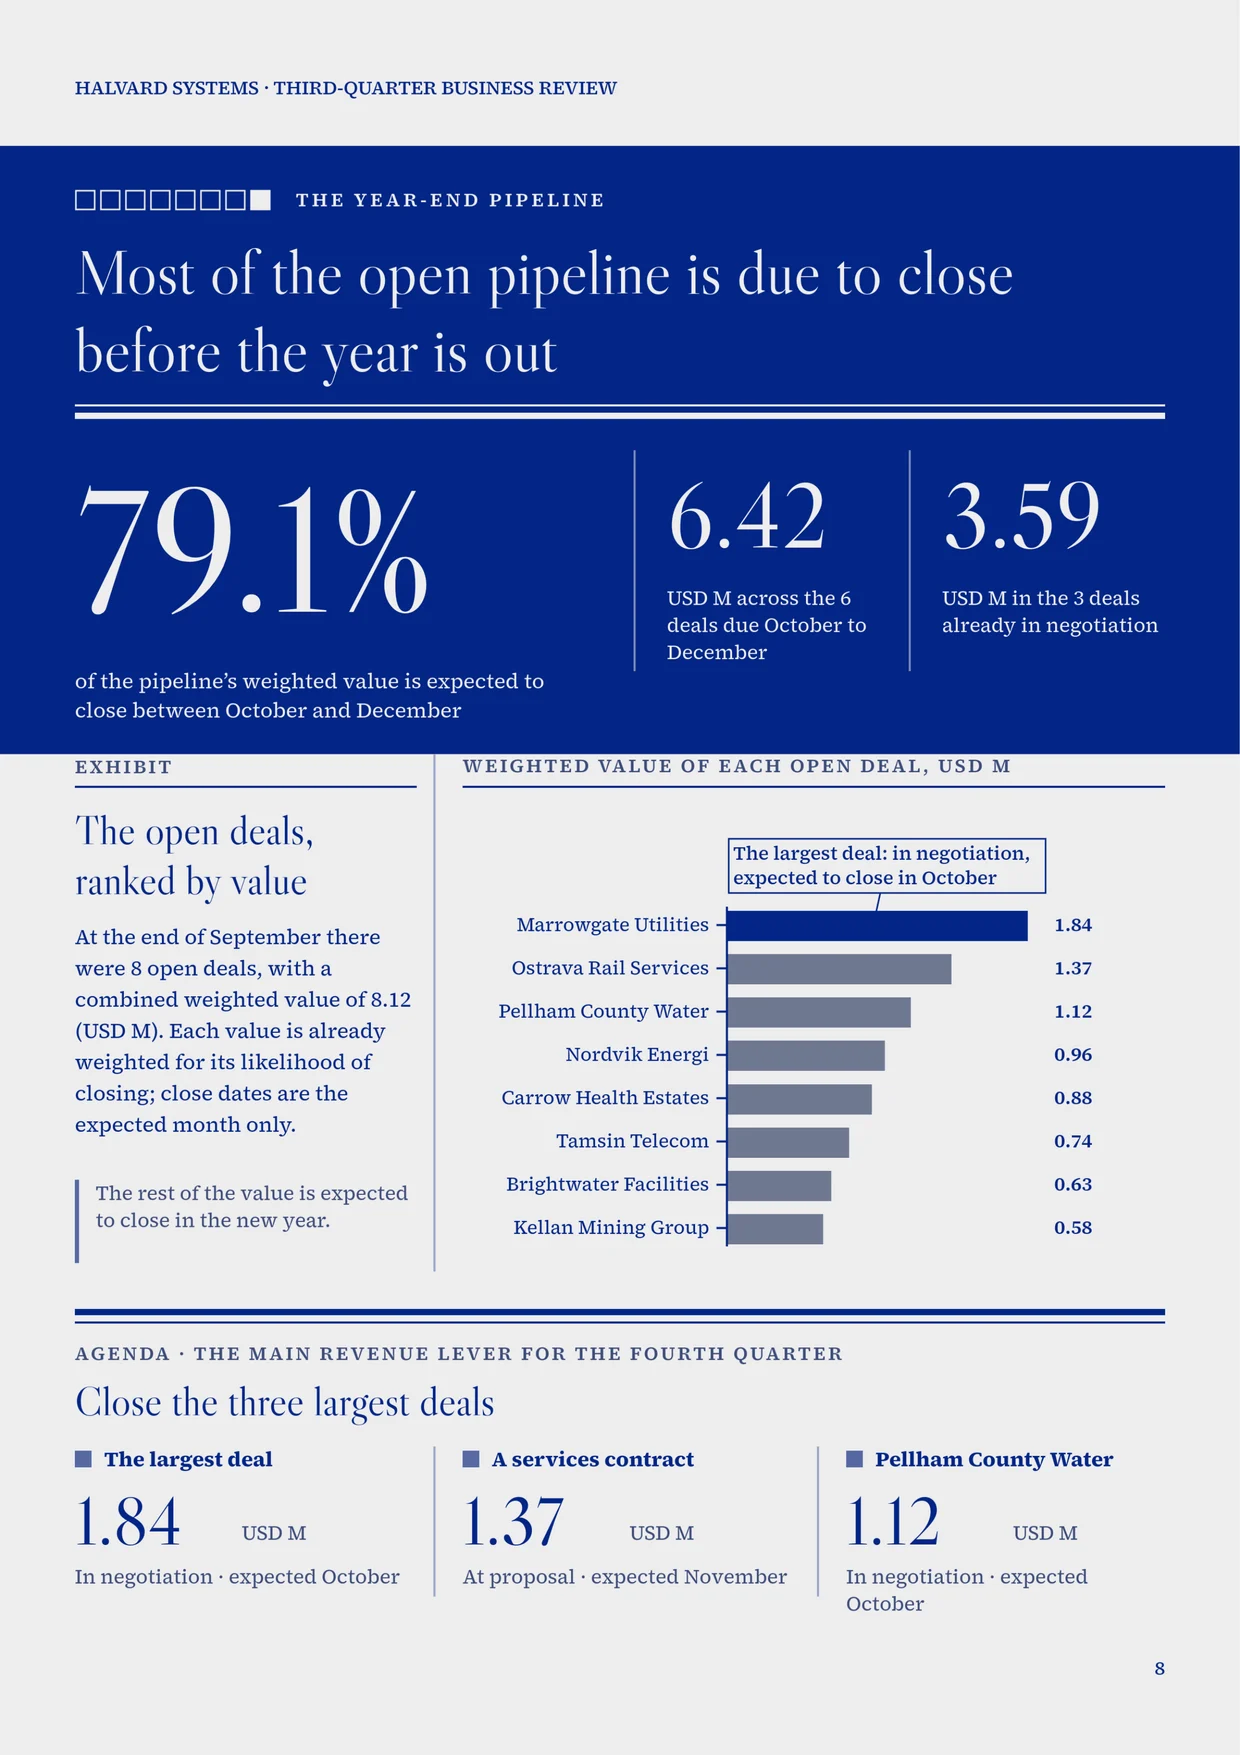
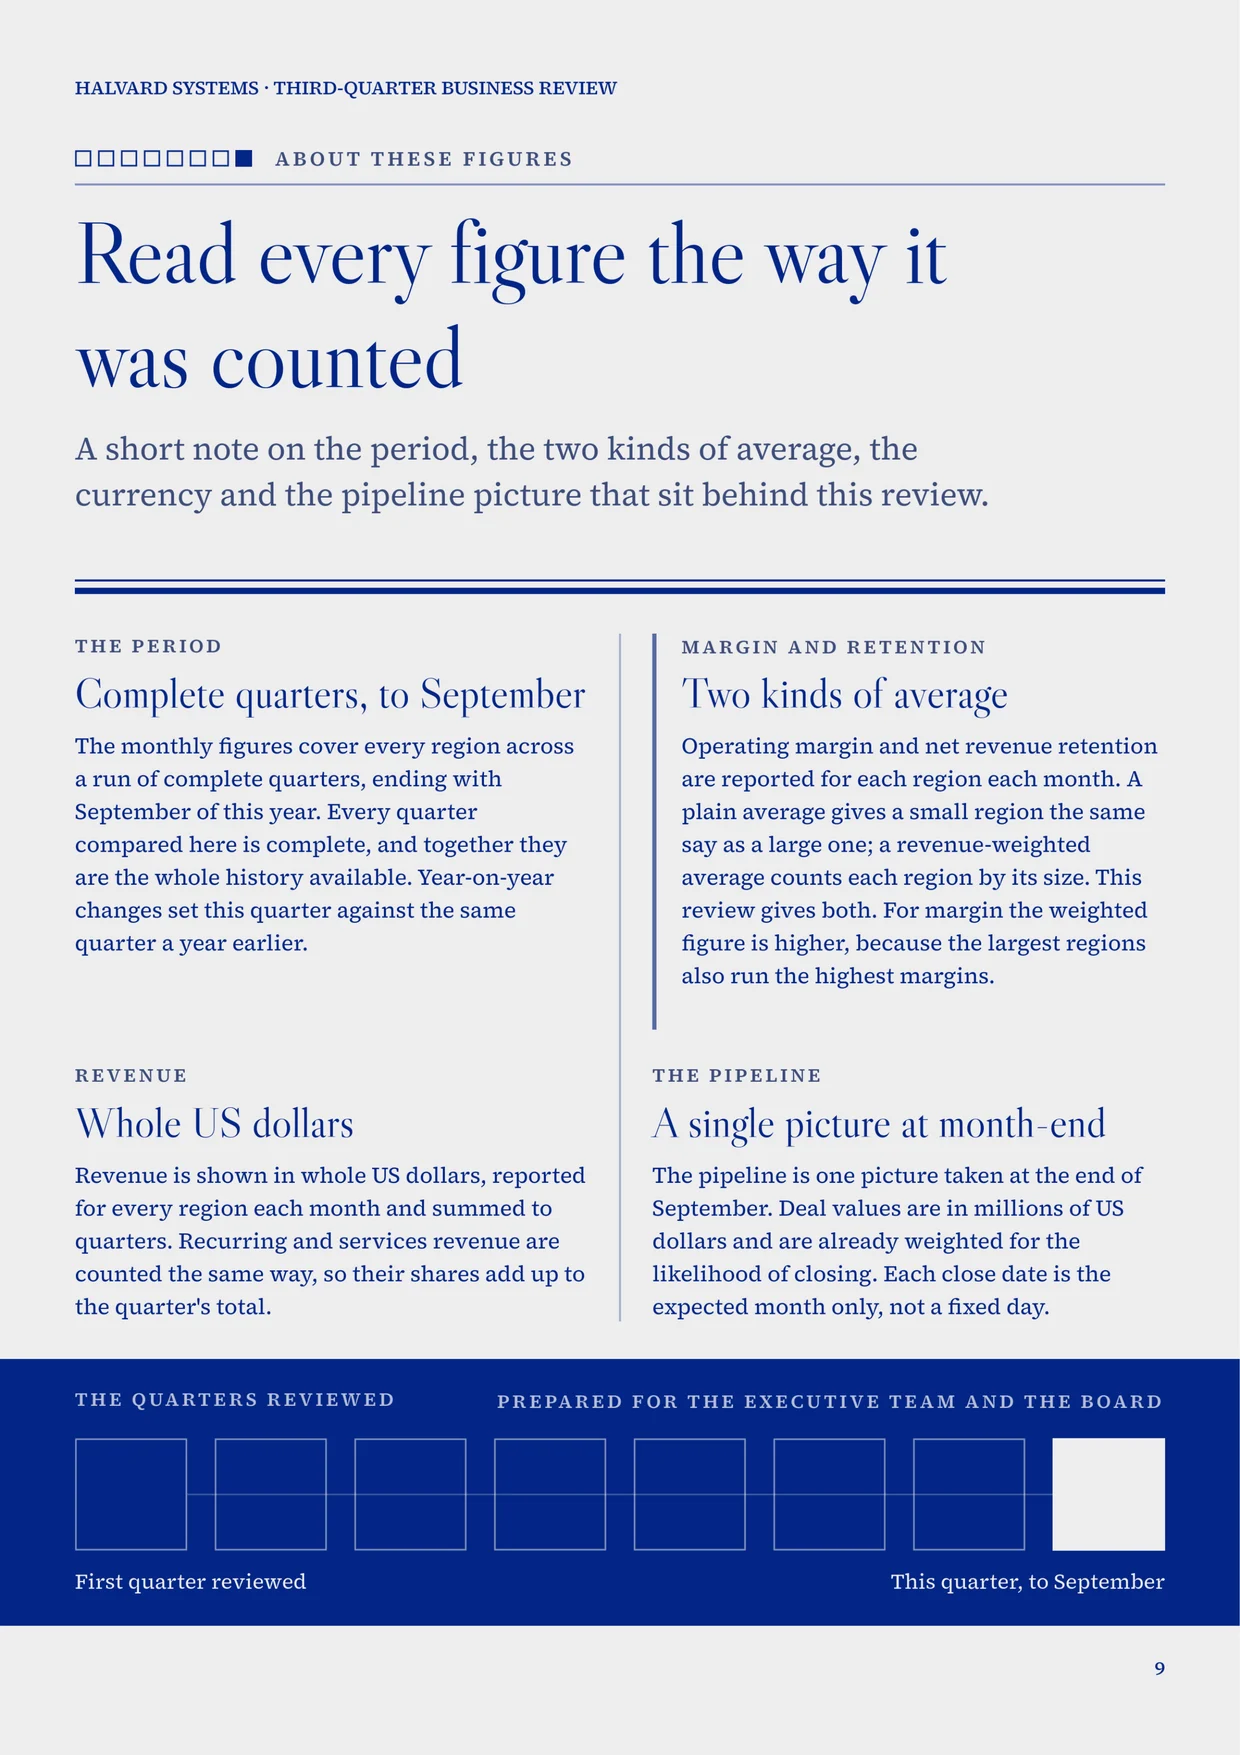
The Halvard Systems review, from data to delivery, in Rahoto. A 27-second film with no sound. It shows the dataset, a plain-words request to Ask Rahoto, the nine pages being built, a chart and its connection to the data, the report checked again against new figures, and the same page delivered as a PDF, a PowerPoint slide and a live link.
Sources, layout, schedule, delivery and audit trail are all part of the document, so the report you send in March is the one you approved in January, with March’s numbers in it. See how AI composes a first draft
Anatomy of a page
What makes a page runnable
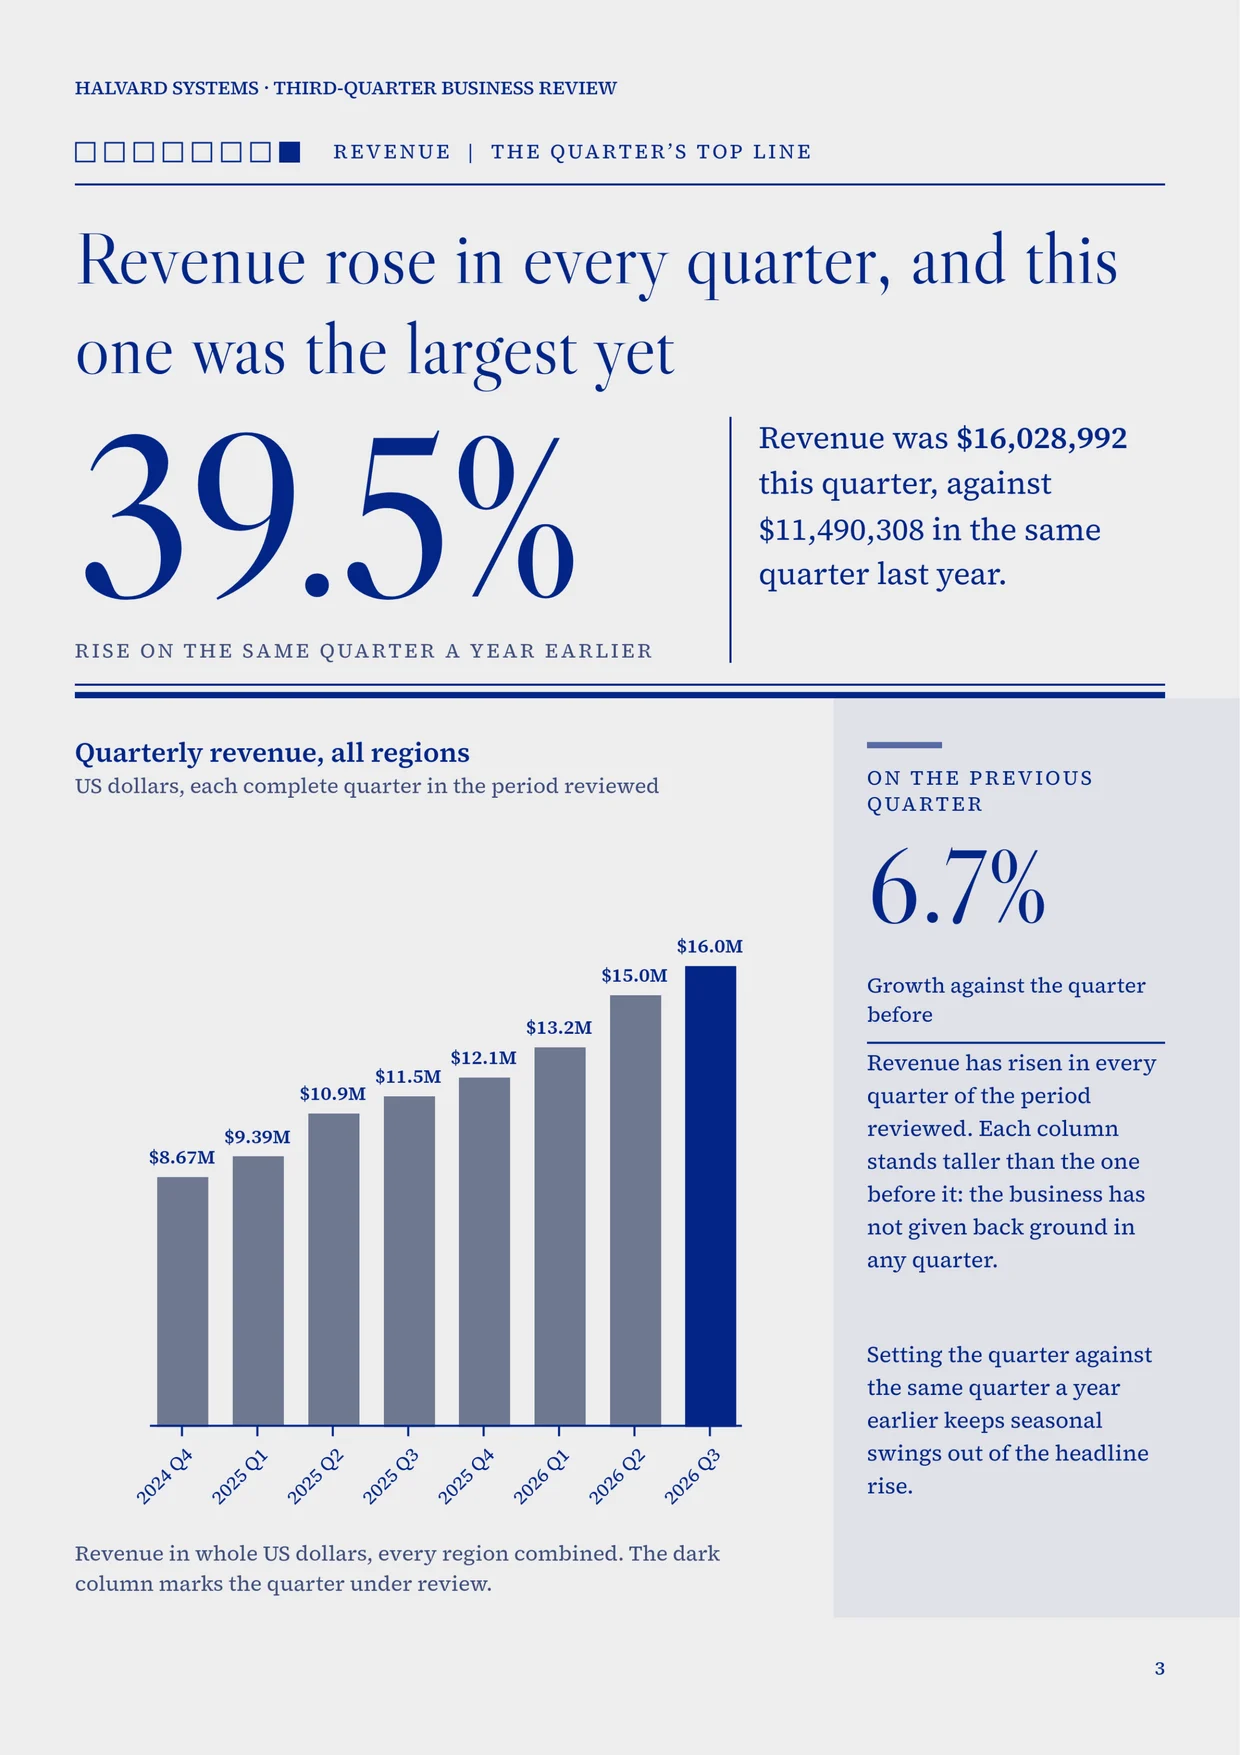
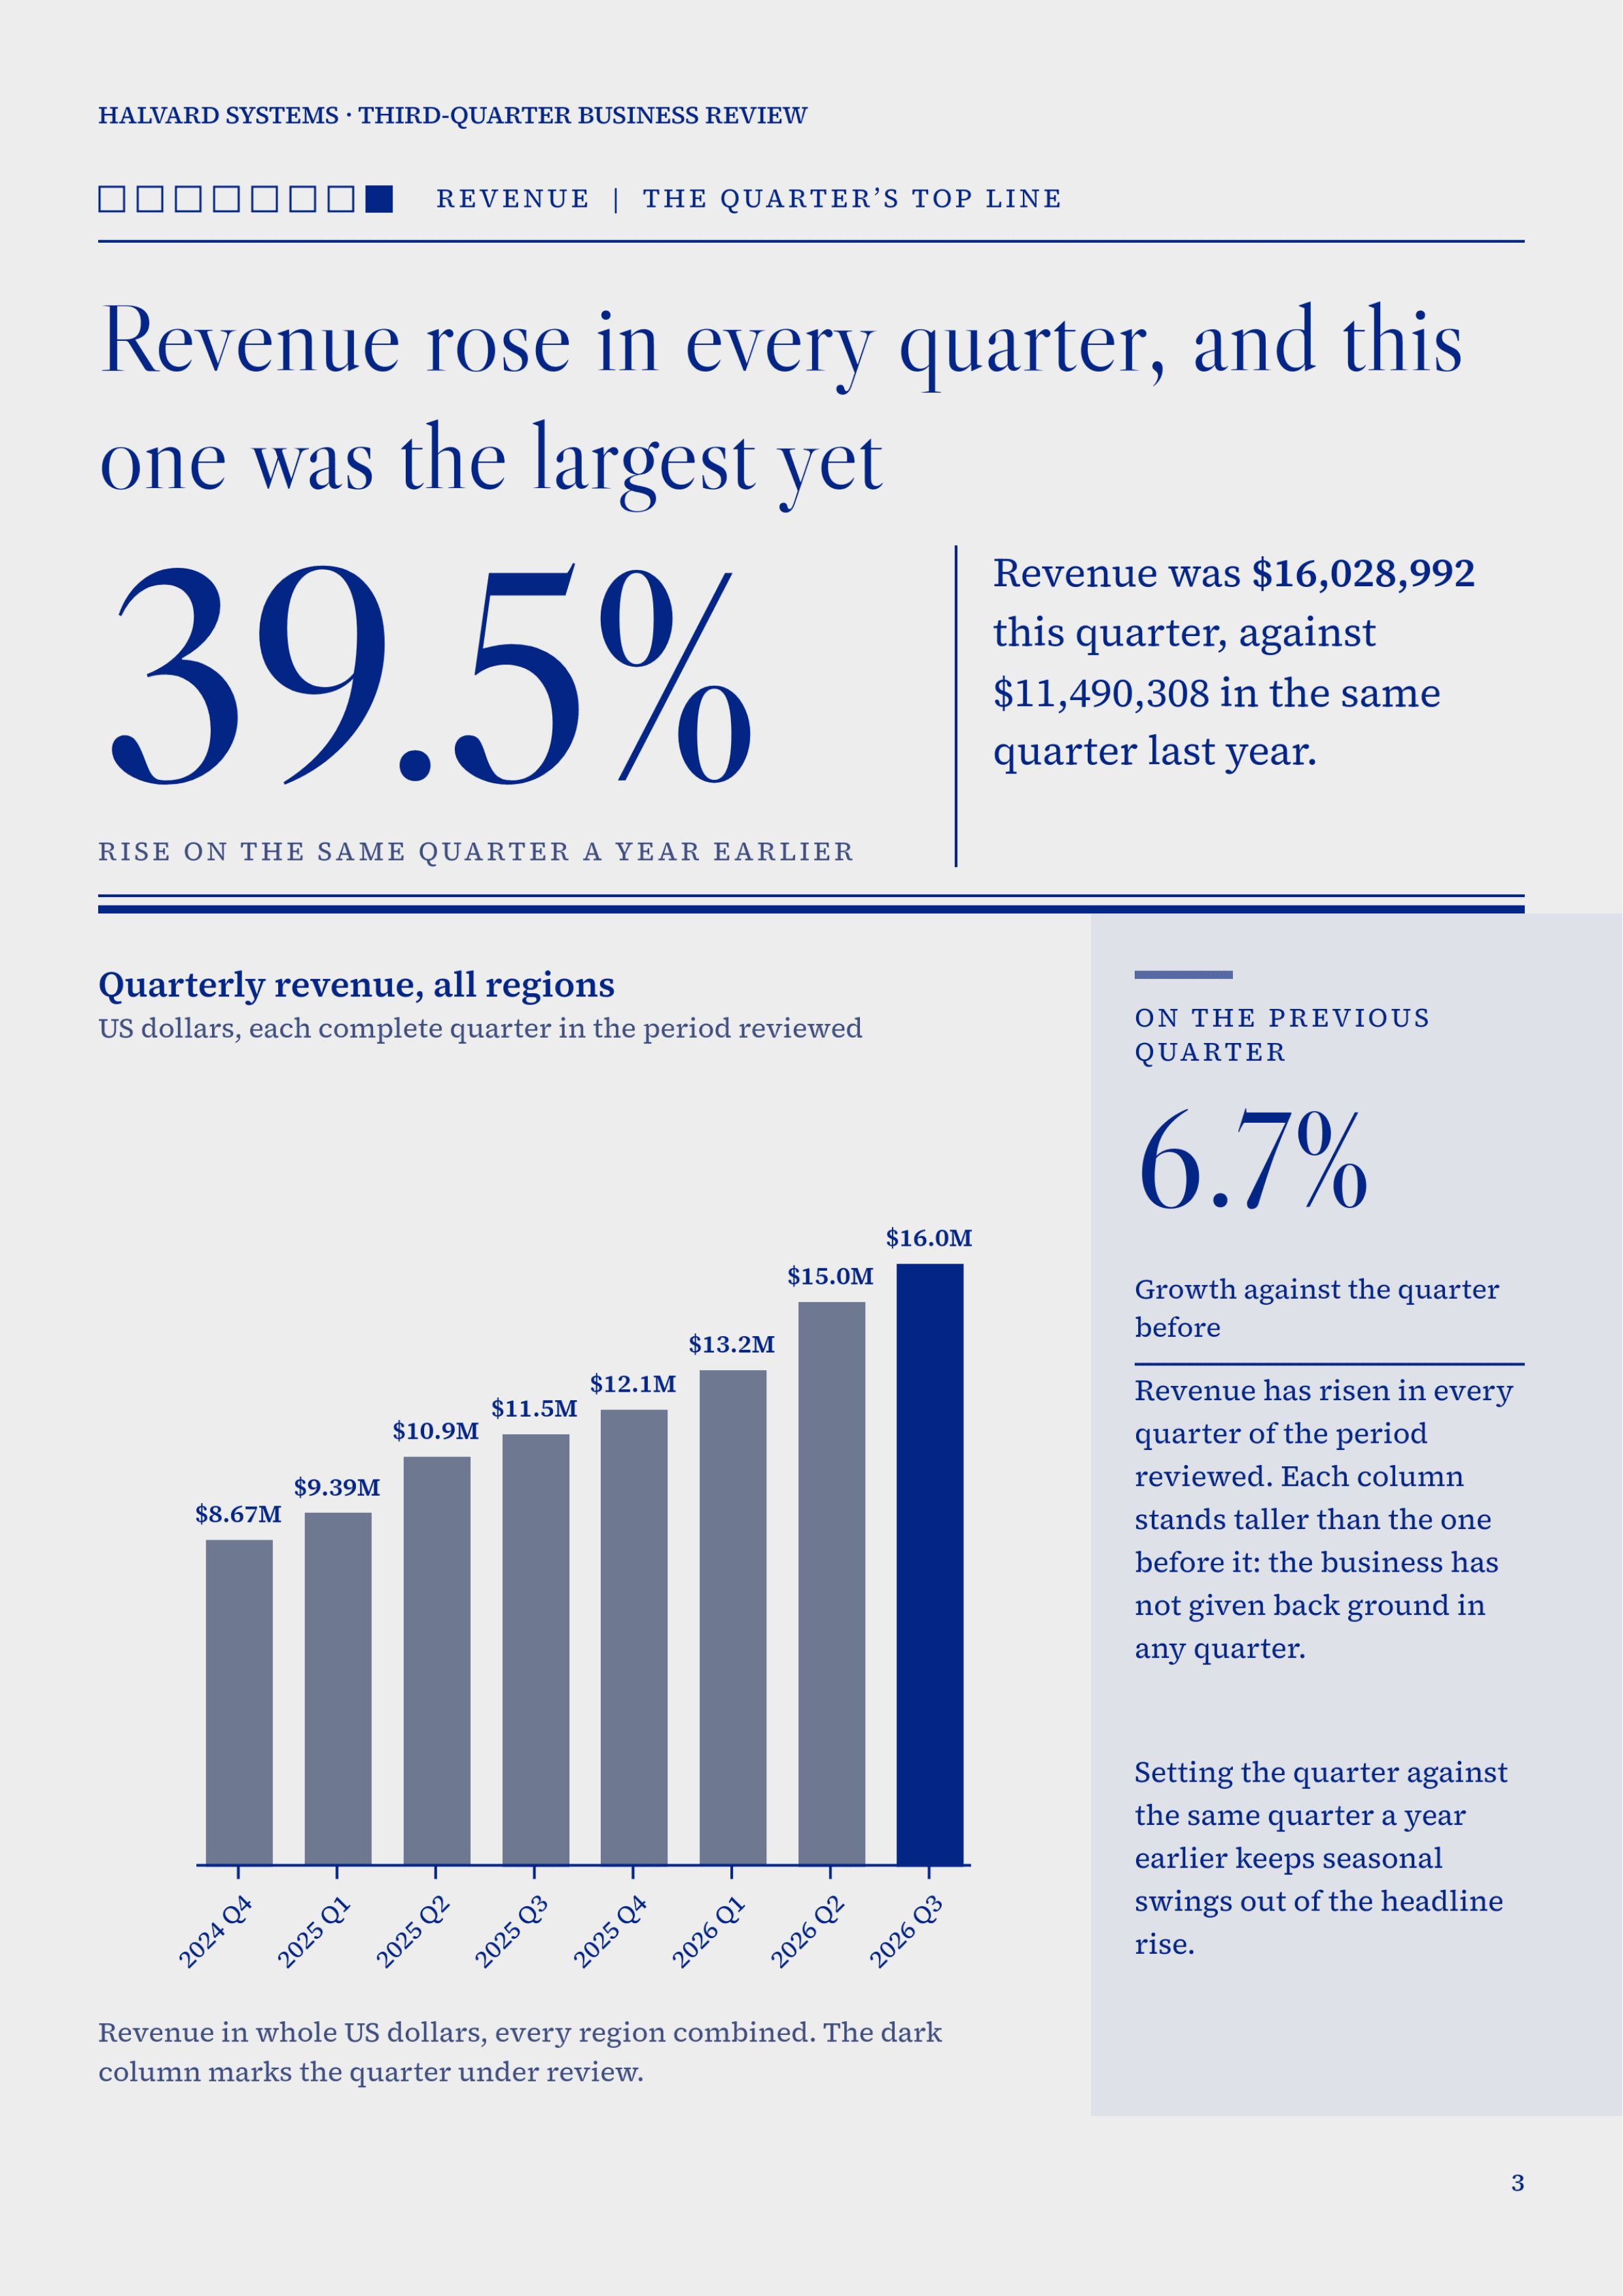
A typeset document bound to live data. This is page 3 of the Halvard review, exactly as Rahoto exported it.
-
A live figure
39.5% is a value from a dataset measure: the quarter’s revenue against the same quarter a year earlier, computed from the Halvard rows on every run. Nobody types it in, so nobody types it wrong.
-
Another, beside it
6.7% on the previous quarter comes from the same rows by a different measure. Each figure on a page can bind to its own.
-
A bound chart
The bars are drawn from the dataset’s rows, not pasted in. When next quarter’s rows arrive, the next run draws them.
-
A page that runs itself
On its schedule, weekdays at 08:00 for example, the page rebuilds from the latest data and goes to the people and channels you chose. Nobody opens a file.
Delivery
It runs on its own schedule
Set the cadence once. Rahoto refreshes the data, rebuilds the pages and delivers them where your readers already work. It retries a delivery that fails and tells you if it still doesn’t go out; after three failed runs in a row it pauses the schedule and tells you why.
Where it arrives
- Slack
- thread or channel
- Teams
- channel post
- inline or attached
- Web
- viewer or embed
- Webhook
- your endpoint
- S3
- bucket drop
- Drive
- shared folder
- SFTP
- your server
Web publishing is on every plan; the other seven channels come with every paid plan. PDF, PowerPoint and PNG travel on any of them.
Before it goes out
Before an issue goes out, Rahoto checks the pages, notices when a source changed shape, and waits for you if the numbers moved enough to matter.
After it lands, it answers
Readers can ask the published report questions and get answers computed from the data published with it. It works on reports whose charts are ready for questions.
Building a recurring pack for leadership? Read how Rahoto handles automated board reporting from live data.
It reads from 73 sources: warehouses, databases, SaaS tools, files and documents. Browse the catalogue Missing a source? Tell us which one
The editor
A design canvas made for reports
The Rahoto editor building the Halvard Systems quarterly review, one action at a time.
-
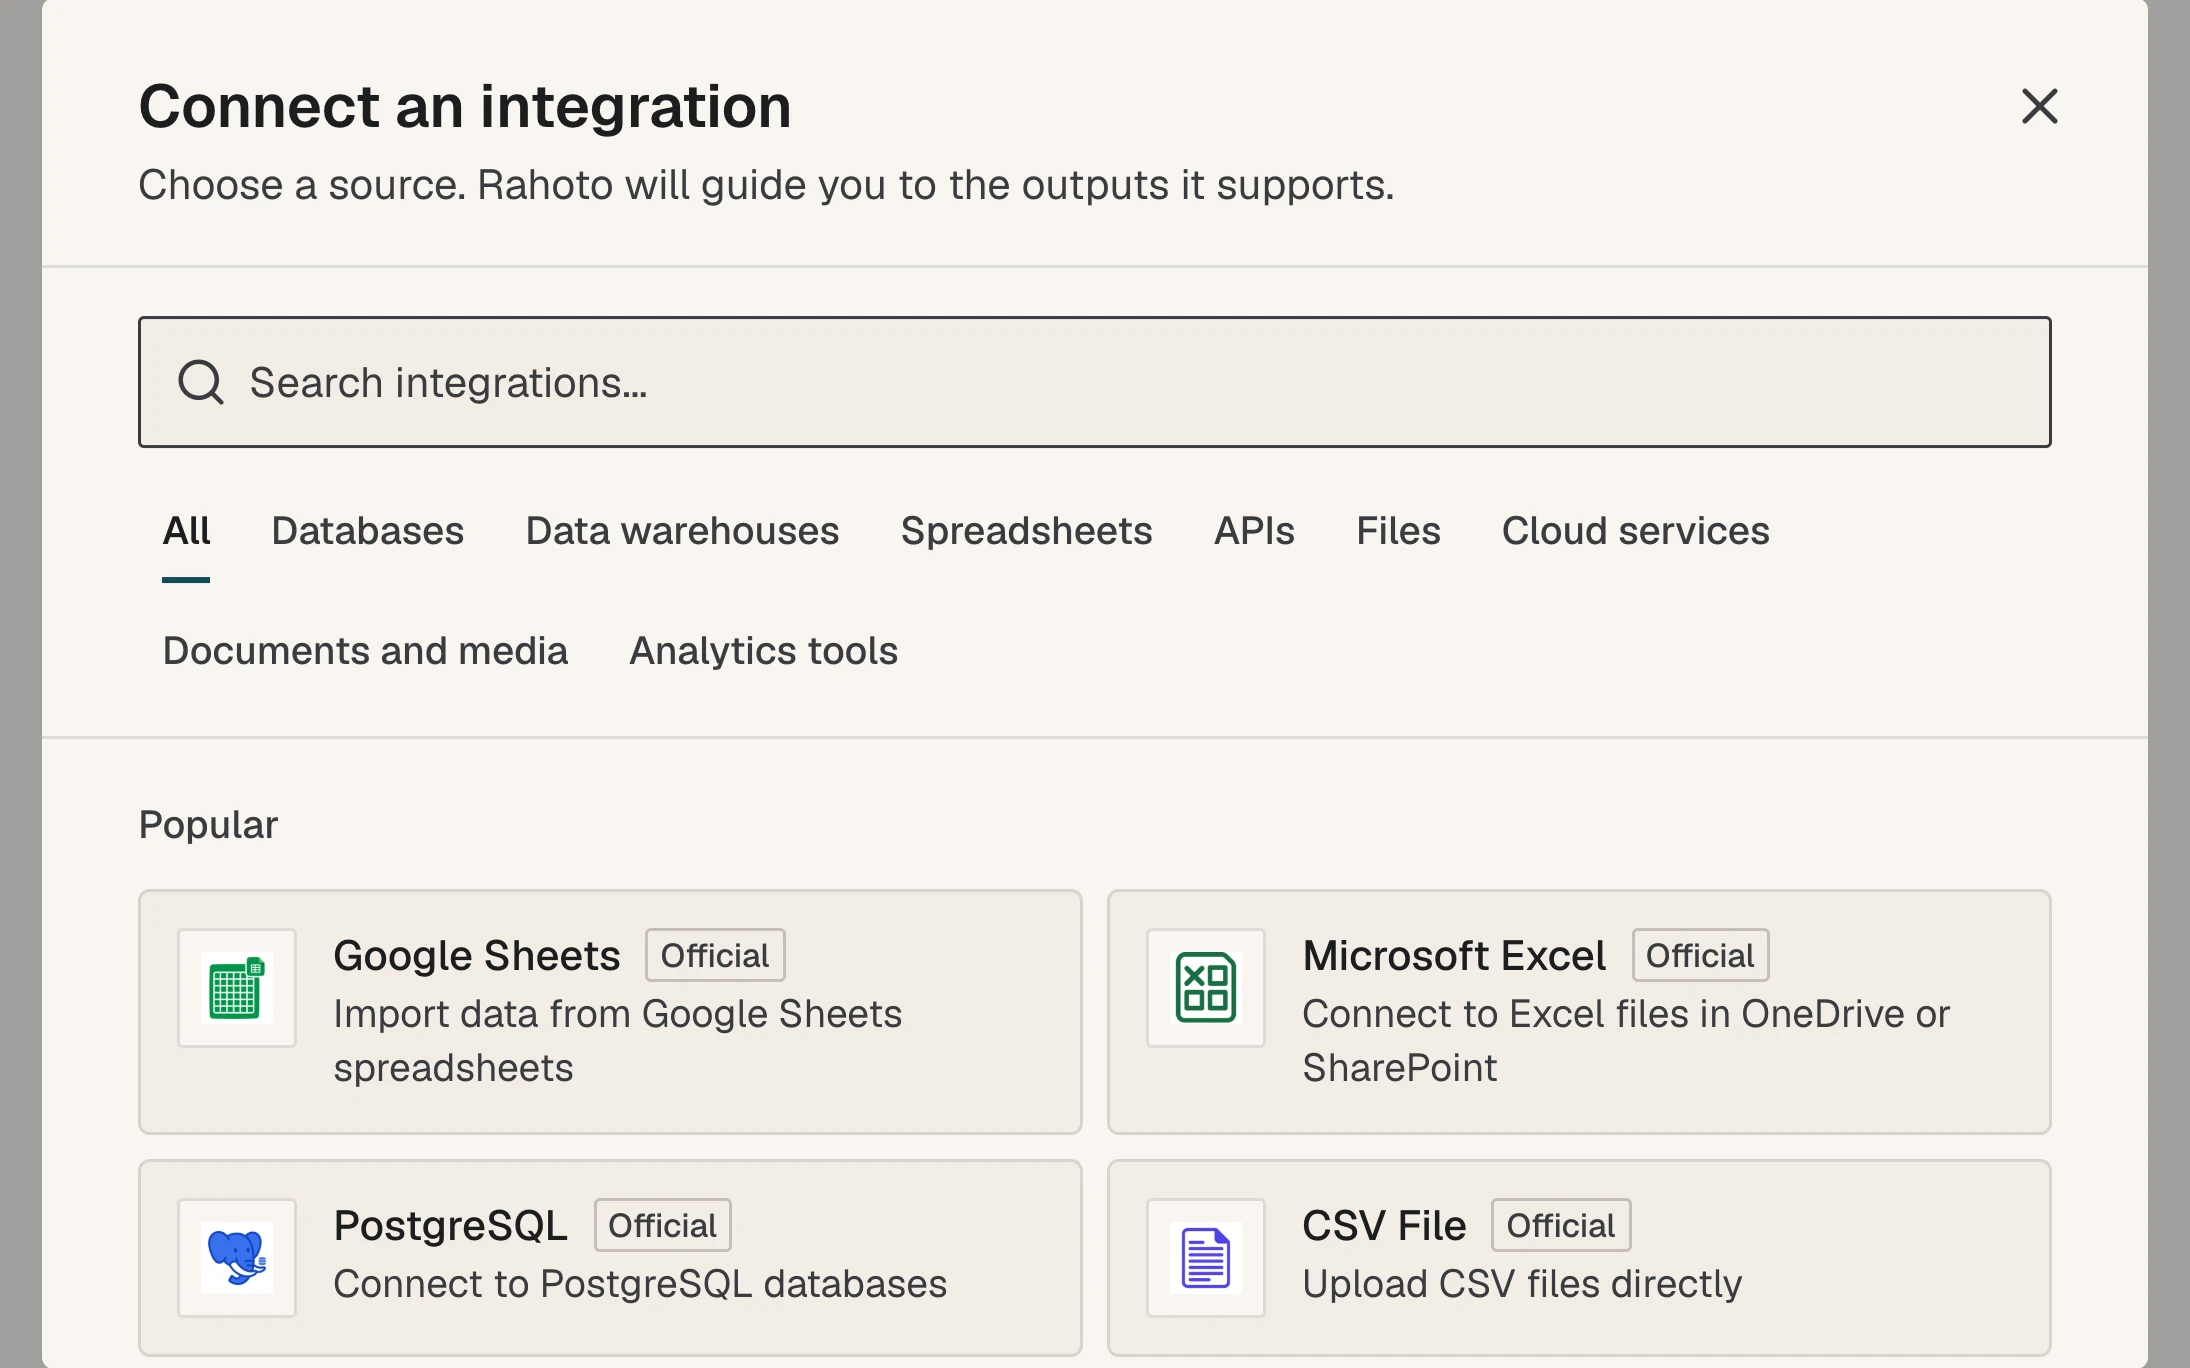
Connect a source
Pick a source from the connector catalogue: databases, warehouses, spreadsheets, APIs, files and documents. Halvard’s monthly figures arrive as a CSV upload.
-
See the data
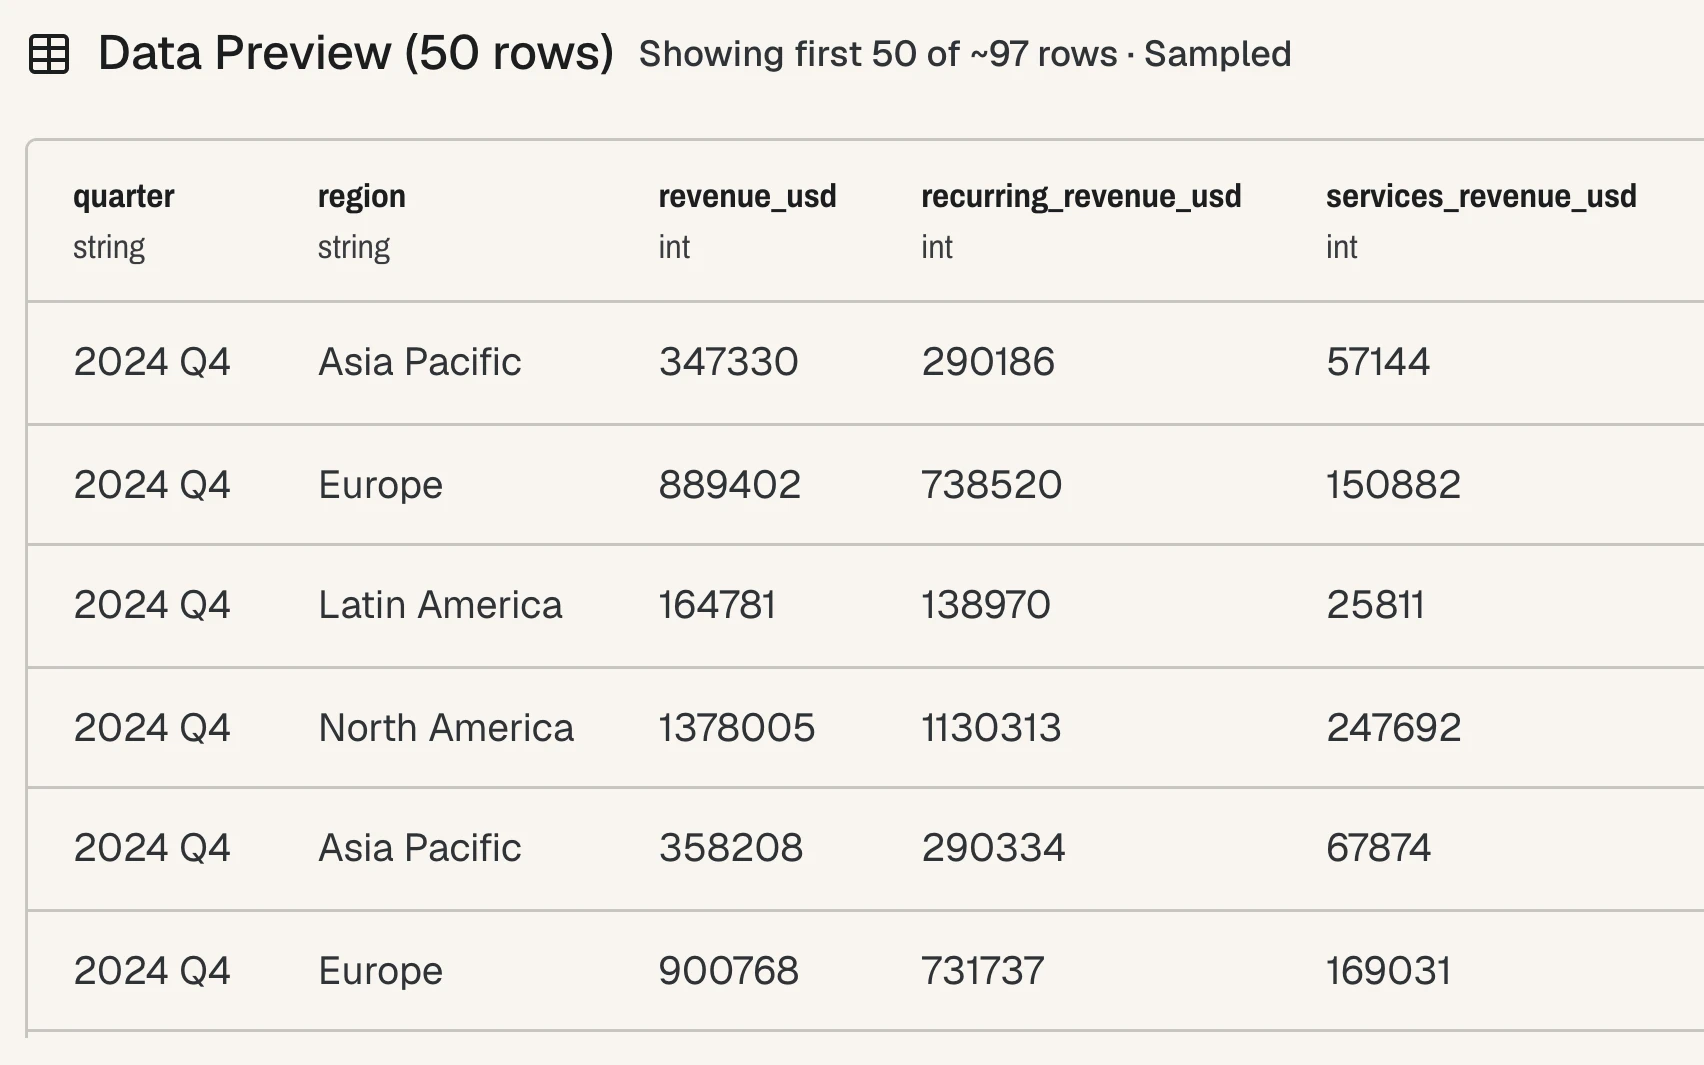
The dataset opens as a typed preview before it touches the report: quarter and region as text, revenue as whole numbers, with a note that you are seeing the first 50 rows of a sample.
-
Bind a chart
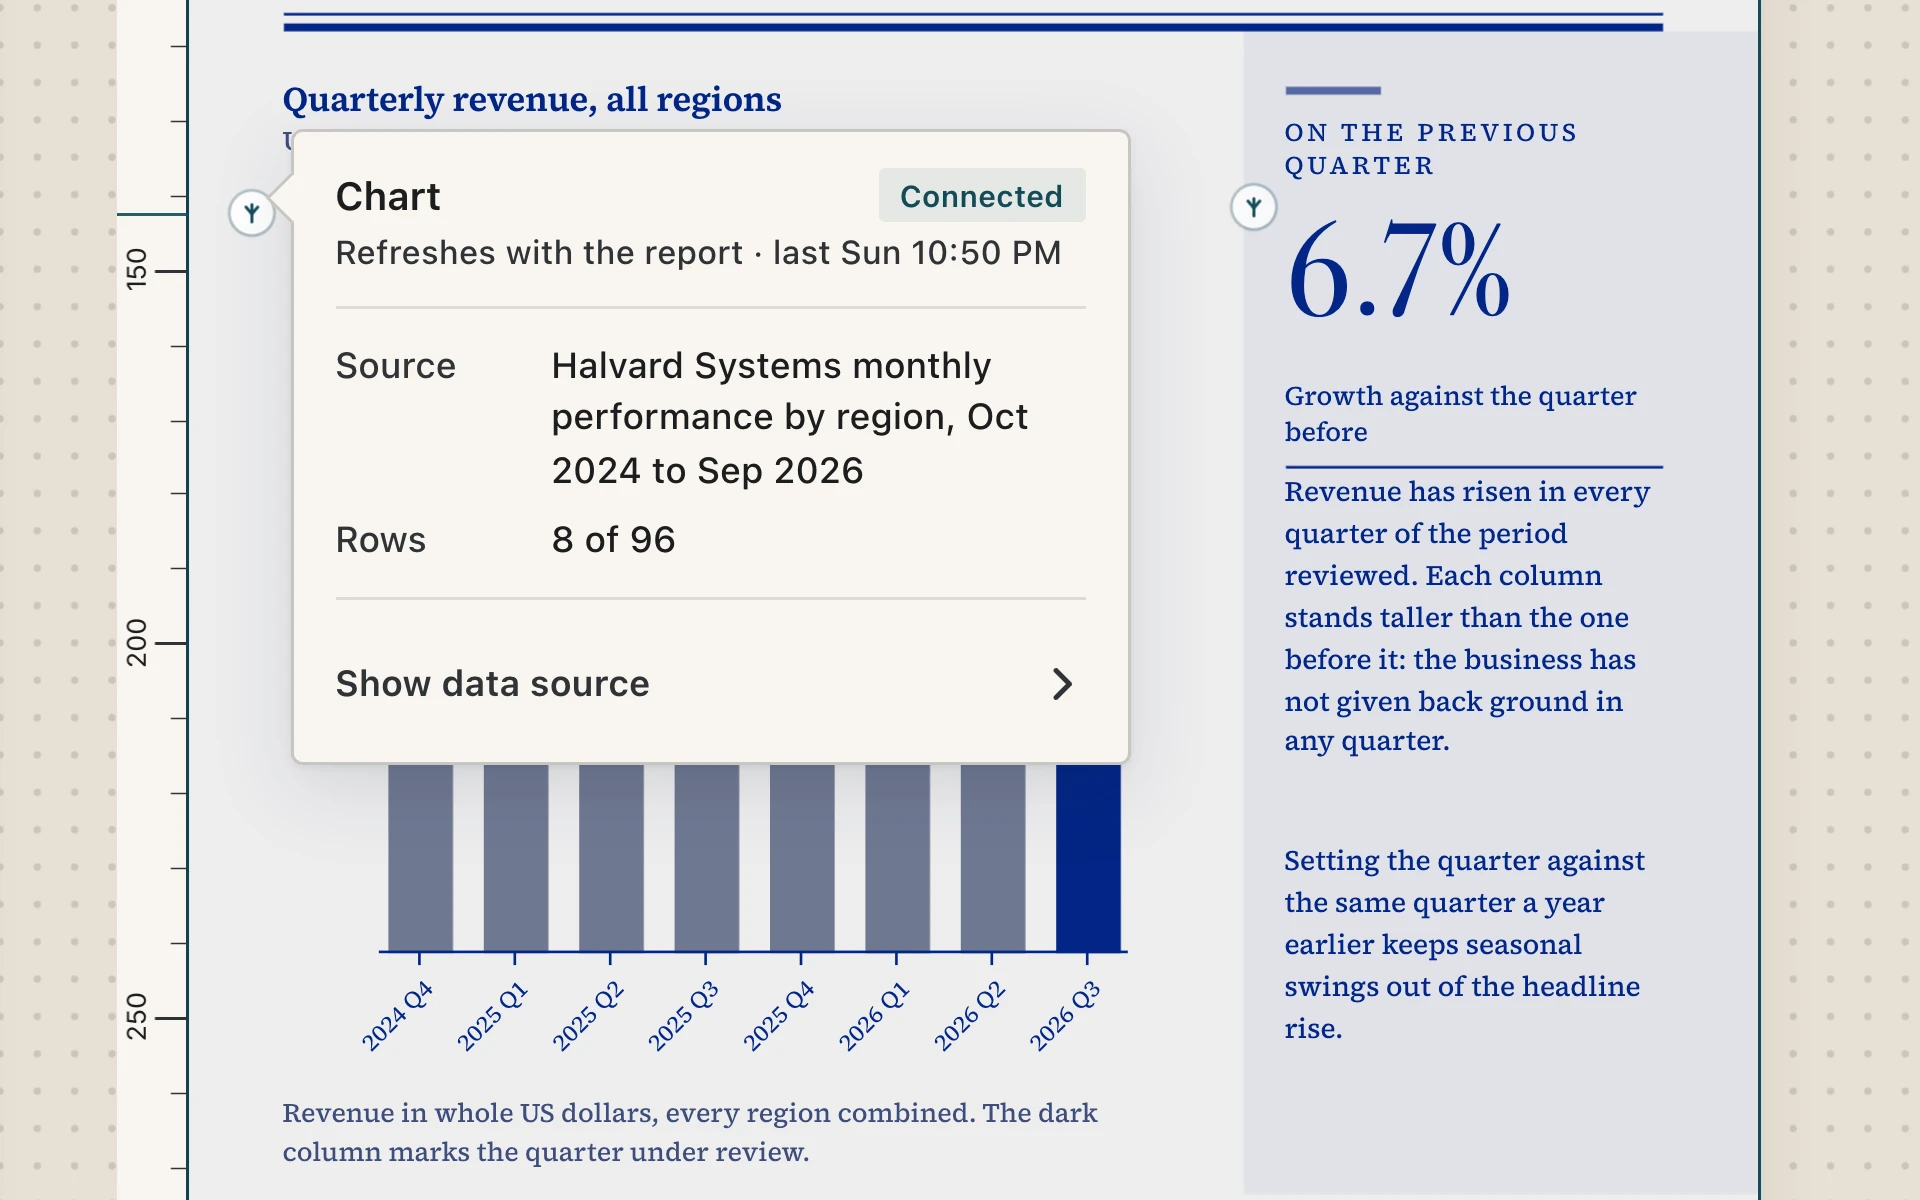
The quarterly revenue chart is drawn from Halvard’s monthly performance by region, eight quarters summed from 96 rows. It refreshes with the report, so next quarter’s bar arrives on its own.
-
Make a figure live
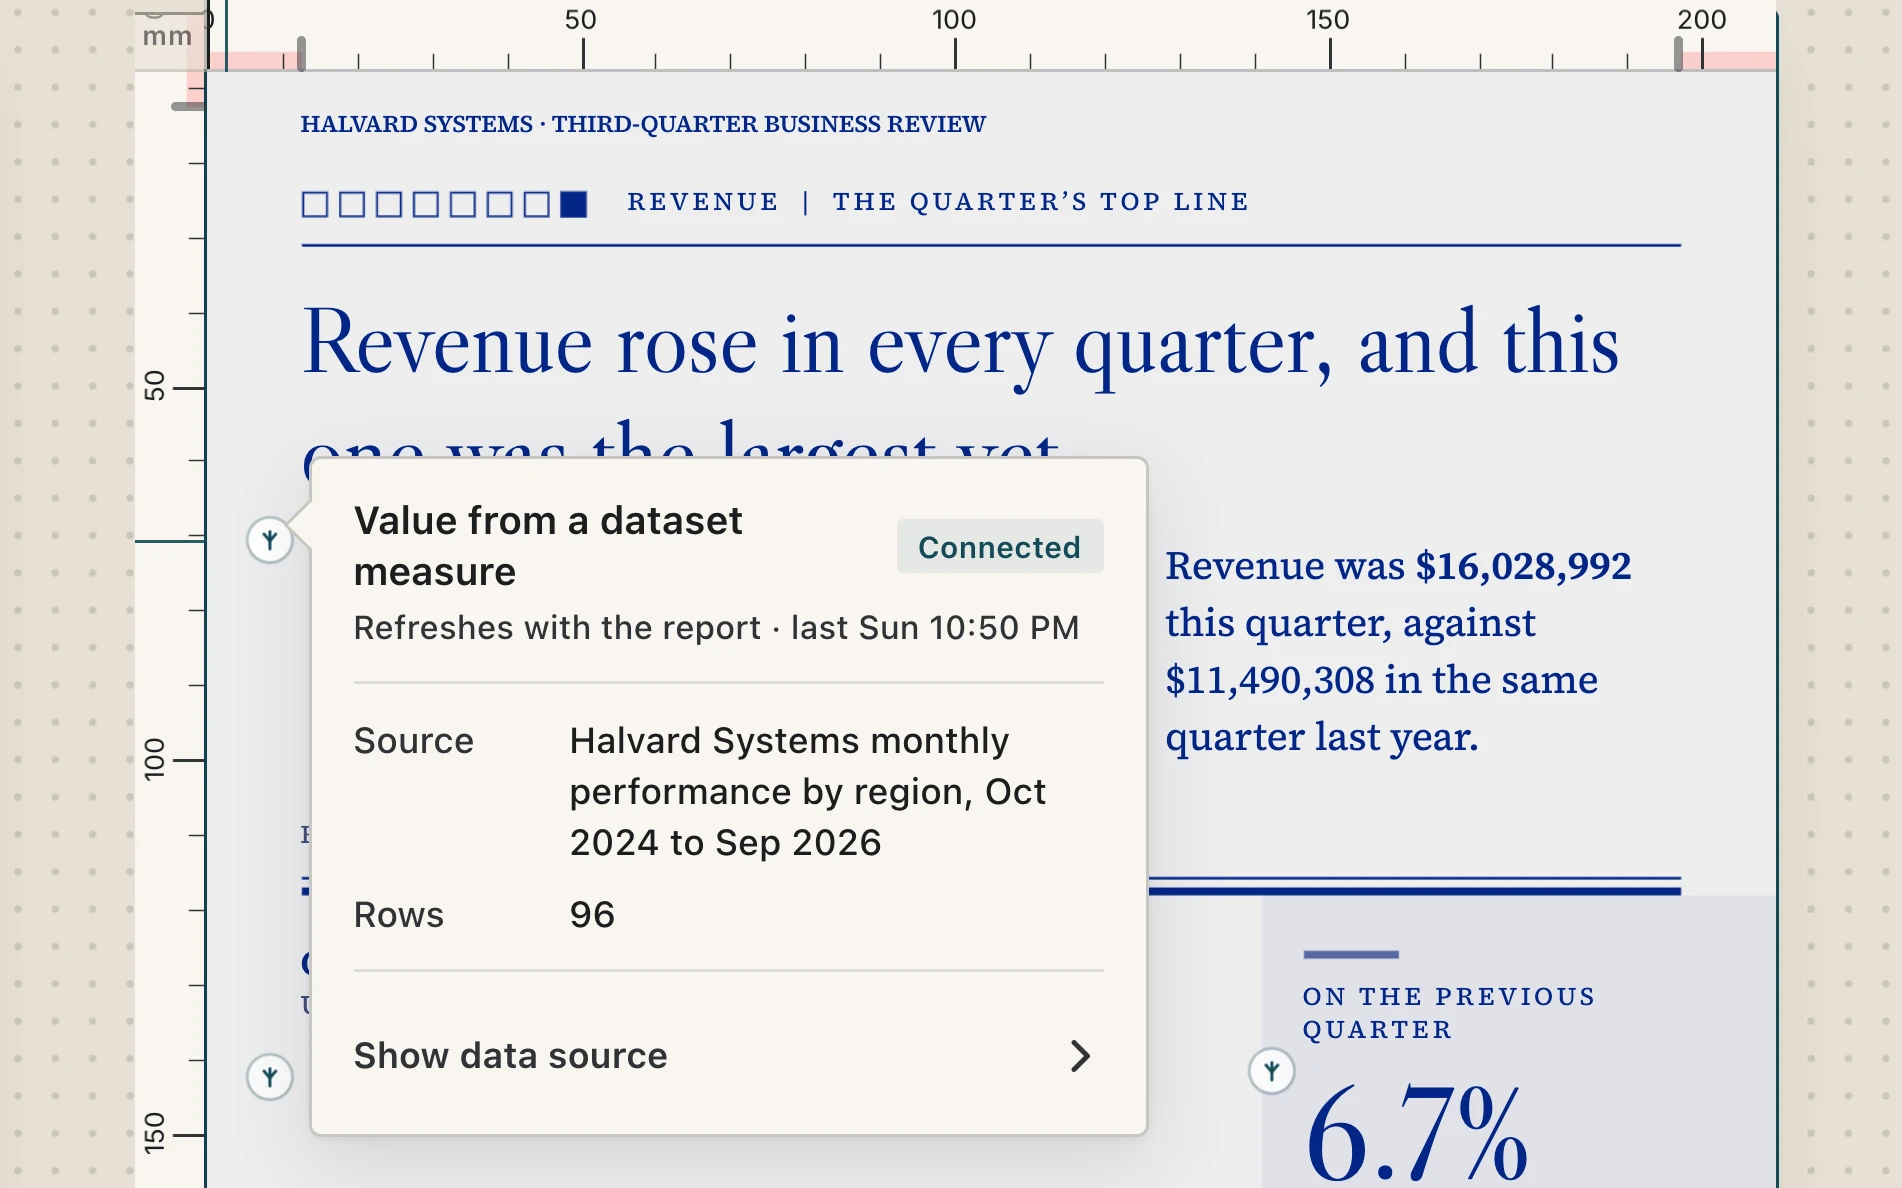
A figure on the page can be a value from a dataset measure. The 39.5% rise on page 3 is computed from the same 96 rows, and it refreshes with the report, so nobody types it in again.
-
Make it yours
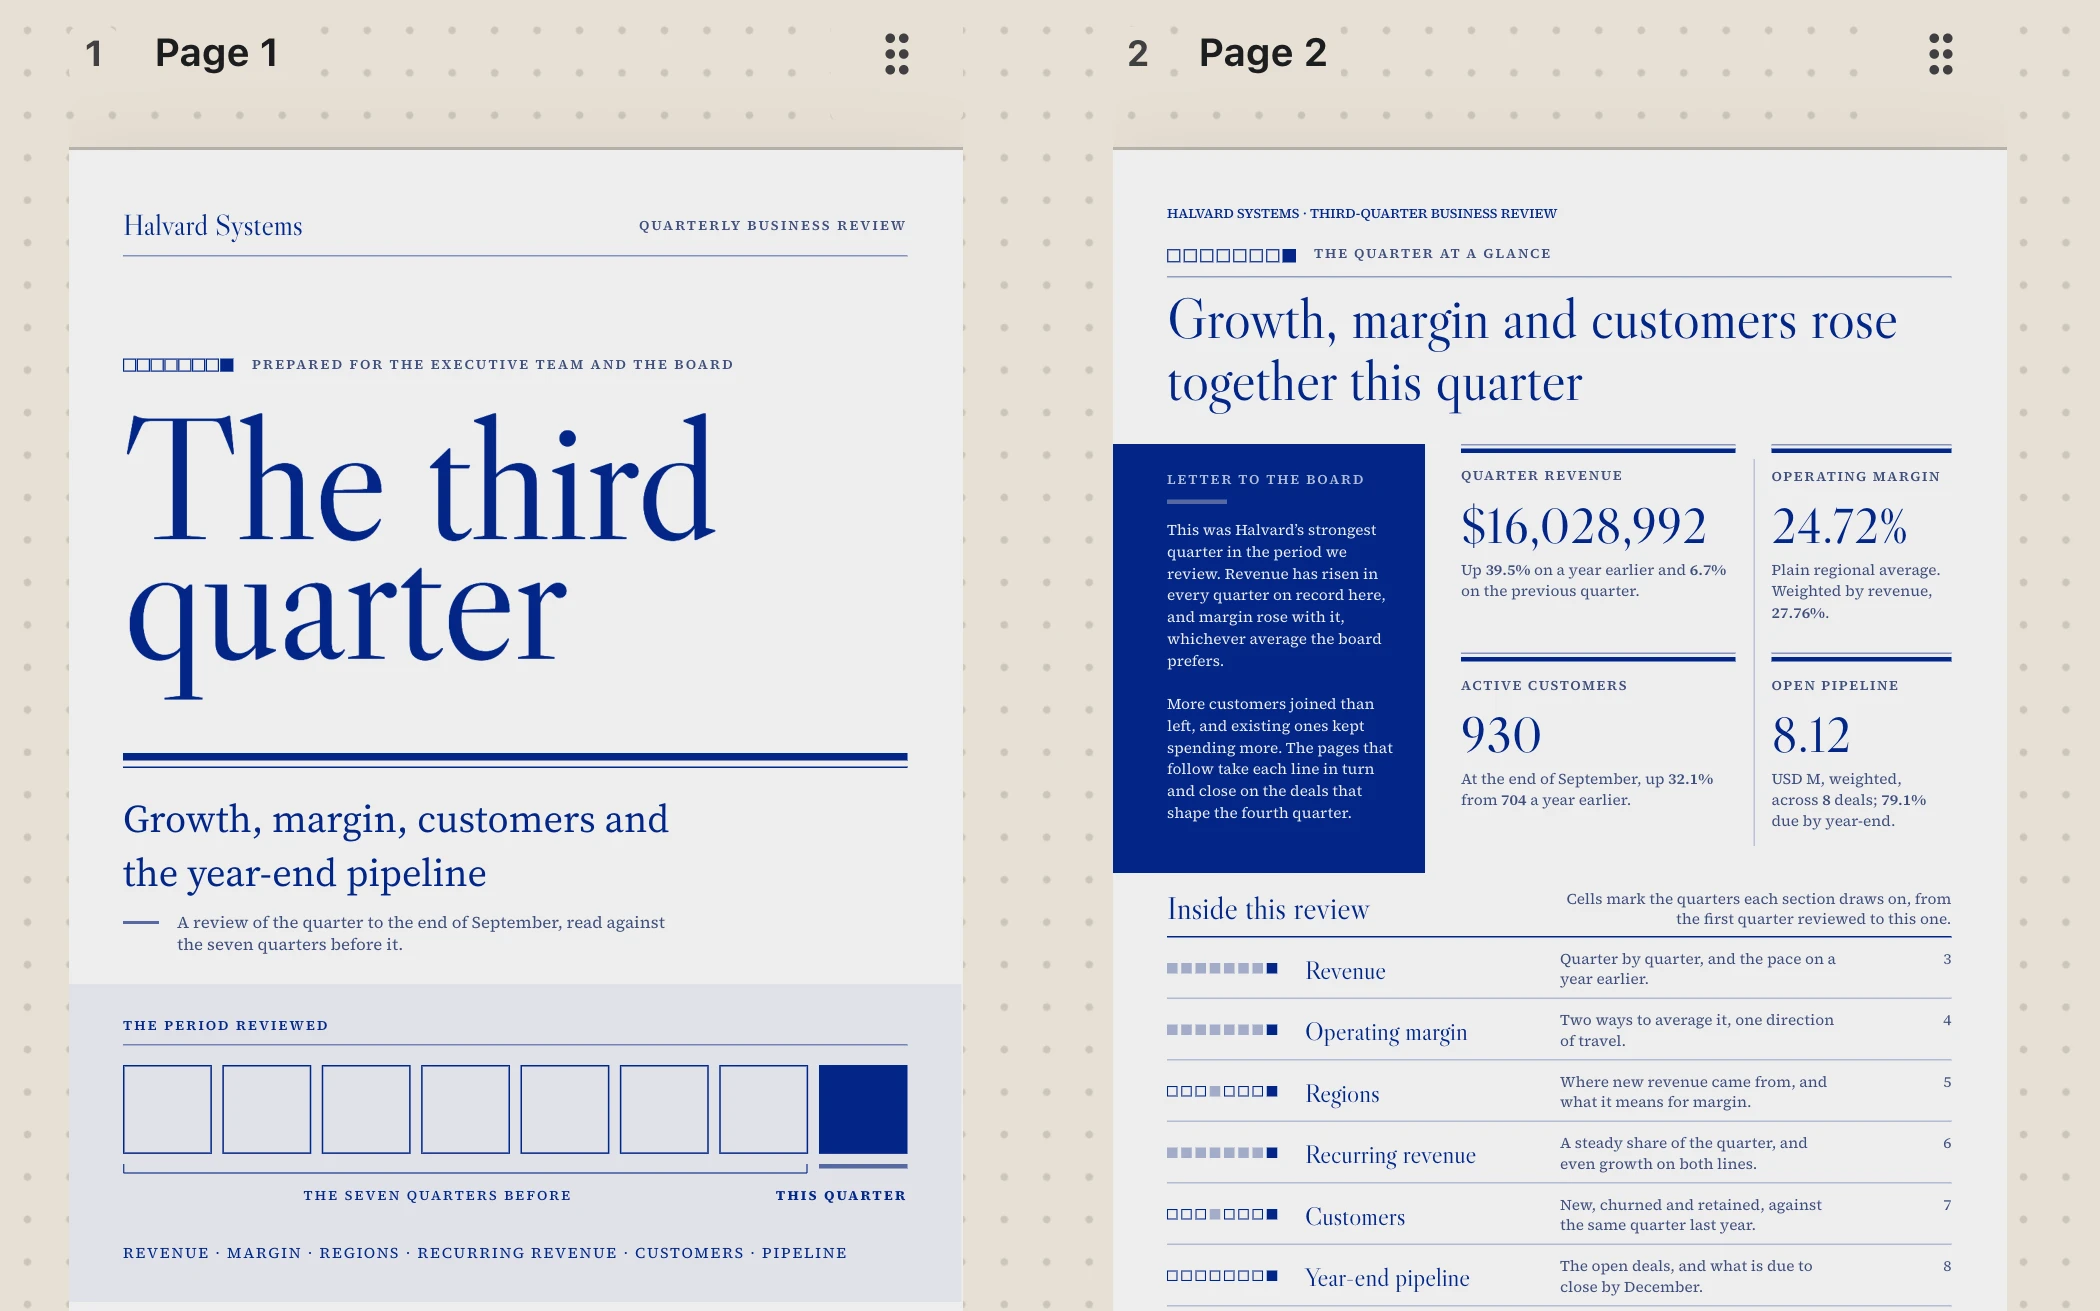
Every page follows one type and colour system, from your brand kit or a style you choose, so the cover and page 2 read as one report. Then any part of a chart can be restyled, one element at a time.
101 chart templates. Explore 200,000 points on the GPU; design up to about 1,000 editable marks.
Analysis
Answers from your data, with the working shown
Pick a dataset, ask in plain words, and get a chart, a one-line finding and how fresh the data is. When a question can’t be answered honestly, Rahoto says why.
- Ask
- Ask in plain words. Rahoto works out the answer from your rows and shows the chart, the finding and how fresh the data is.
- Trust
- Every figure in a draft must come from a query Rahoto ran on your data: a query naming a field your data doesn’t have is refused, and a page with an untraced figure goes back before you see it. Before each scheduled issue it checks the text against the data, and the same data rules hold in the report you send.
- Keep
- Turn on “keep up to date” and Rahoto reruns the answer when the data refreshes and tells you if it changed. It never approves anything for you.
Trust
Your rules travel with your data
Who may see which rows and columns is set once by your data owners and holds in analysis, in the editor, in reader questions and in every delivered issue. A report goes out with its publisher’s access, never more.
Rahoto’s AI starts from your dataset, your report and your brand kit, not a blank chat box. AI providers see the shape of your data (columns, types, summary figures), not your rows, and names and identifiers are swapped for stand-ins before a request leaves, and swapped back when the answer returns. Each control below names the plan that includes it.
- Read-only connections
- Every plan
- Connectors read from your sources and are read-only by default.
- SAML SSO and SCIM
- Enterprise
- Sign-in and user provisioning from your own identity provider.
- Customer-managed keys
- Enterprise
- Credentials and sensitive columns encrypted under your key in AWS, Azure, Google Cloud or HashiCorp Vault.
- Tamper-evident audit log
- Business and Enterprise
- An exportable record of every action.
Measured, and how we know
- 200K points
- explored on the GPU at about 8 ms a frame, with up to about 1,000 marks editable one by one.
- How we know: Median frame time panning a 200,000-point scatter in headed Chromium on hardware WebGL2, from the chart engine’s end-to-end render test.
- Hosted in Helsinki
- Hetzner runs the application servers and the database there.
- How we know: The sub-processor list. Files, exports and backups are stored by Cloudflare R2 in Western Europe. Sub-processors
Pricing
Priced per workspace. Editors included, viewers free
Viewers and commenters are free and unlimited on every plan.
-
Starter
$29 per workspace / mo · or $290/yr
For one person sending reports on a schedule.
-
Pro
$79 per workspace / mo · or $790/yr
For a small team that edits together and publishes on a schedule.
-
Enterprise
Custom annual contract, from $25,000/yr
For organisations under security review and at reporting scale.
Questions
Questions people ask
What a team asks before it moves a recurring report onto Rahoto.
Does my data leave my warehouse?
Only what a report needs. Rahoto reads a connected source on demand or on the schedule you set, either querying it live or refreshing a snapshot, and it only reads: database queries run in read-only mode. To run and reproduce reports it stores report documents, bounded data snapshots and generated files, following your retention settings. The app and its database run on servers in Helsinki, in the EU; files and backups are stored with Cloudflare R2 in Western Europe. As text, AI providers get your data’s structure, summary statistics and category labels, plus what a task works on: the grouped results of the queries it runs (at most 50 rows each), the report’s own text and figures, anything you point Ask Rahoto at, and passages from text sources you analyse. Names, emails and other common identifiers in that text are pseudonymised first. Images of report pages, and files you send for transcription or text extraction, cannot be pseudonymised, so they go to a cloud model only when your data’s classification allows it. Enterprise adds customer-managed encryption keys and a residency setting that keeps AI requests in the EU.
What does it cost?
A new workspace starts on a 14-day Starter trial with no credit card, one trial per account. When the trial ends the workspace turns read-only until you choose a plan; nothing is deleted. Plans are priced per workspace and include a number of editors; larger plans can add editors at a monthly price per editor. Viewers and commenters are free and unlimited on every plan. Enterprise is an annual contract.
Can I use ChatGPT, Claude or another AI assistant for this instead?
Use them to think, ask questions and explore: many now connect to your data and build dashboards. A report you send every cycle needs more. Rahoto applies data rules to each reader, including people outside your company, so everyone sees only their share. It lays the numbers out as a designed, paginated report in your brand, checks the words against your data before each issue goes out, and delivers every issue on your schedule as a PDF, PowerPoint or web link, by email or Slack. Rahoto itself drafts with models from Anthropic, OpenAI and Google, so you use them through Rahoto rather than instead of it. See Rahoto and AI assistants side by side.
How is Rahoto different from an AI dashboard?
AI dashboards answer your questions on screen. Rahoto delivers the report to everyone who needs it: designed to your brand, checked against your data, and in a version for every audience, so each reader sees only what they’re allowed to, including people outside your company. See Rahoto and AI dashboards side by side.
How is it different from Power BI or Looker?
Power BI and Looker are built for analysts to explore data on a screen. Rahoto is built for the people who need the answer and the report. Ask your data a question in plain words, keep the answers that matter, and Rahoto turns them into a designed report that refreshes and is delivered on schedule. What arrives is the report itself, in your brand, as a PDF, a PowerPoint deck or a live link, not a picture of a dashboard. It reads from the warehouse and semantic layer you already trust, so if you use a BI tool, Rahoto works alongside it rather than replacing it. See how Rahoto compares to dashboards, BI tools, and slide decks.
Is Rahoto a dashboard?
No. A dashboard stays on a screen and waits to be opened. A Rahoto report is a paginated document that refreshes from live data and is delivered to the people who read it.
Start with the report you send most often.